Cnuibacter physcomitrellae
Taxonomy: cellular organisms; Bacteria; Terrabacteria group; Actinobacteria; Actinomycetia; Micrococcales; Microbacteriaceae; Cnuibacter
Average proteome isoelectric point is 5.92
Get precalculated fractions of proteins

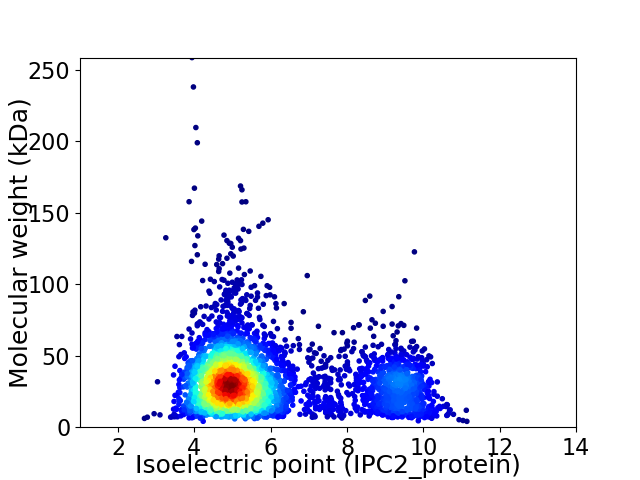
Virtual 2D-PAGE plot for 4009 proteins (isoelectric point calculated using IPC2_protein)
Get csv file with sequences according to given criteria:
* You can choose from 21 different methods for calculating isoelectric point
Summary statistics related to proteome-wise predictions


Protein with the lowest isoelectric point:
>tr|A0A1X9LP24|A0A1X9LP24_9MICO HTH deoR-type domain-containing protein OS=Cnuibacter physcomitrellae OX=1619308 GN=B5808_12960 PE=4 SV=1
MM1 pKa = 7.73SDD3 pKa = 3.86DD4 pKa = 4.16RR5 pKa = 11.84NNPGPQQSGEE15 pKa = 4.39DD16 pKa = 3.66GQQPSRR22 pKa = 11.84GADD25 pKa = 3.08RR26 pKa = 11.84TGDD29 pKa = 3.48LPAYY33 pKa = 8.11PVQGQGDD40 pKa = 4.27SGPAFPGYY48 pKa = 9.27PPQGQPGSGVPPQGPQSPNAAPPTGAPQPHH78 pKa = 7.43PGYY81 pKa = 10.03GQPQSPQPHH90 pKa = 7.27PGYY93 pKa = 10.53GPQPPTYY100 pKa = 9.5GQPQGQPPQSGPQPHH115 pKa = 7.39PGYY118 pKa = 10.17GQPQAQTPQWAQGAPNGSGRR138 pKa = 11.84PPKK141 pKa = 10.26KK142 pKa = 10.08GLSVGALIGIIGGGVFLLLVIGVIVAIVVIRR173 pKa = 11.84SVASPAGGGTSQSTSPSQVVTEE195 pKa = 4.22YY196 pKa = 10.02LTAIADD202 pKa = 3.75GDD204 pKa = 3.96AEE206 pKa = 4.28KK207 pKa = 11.04ALGYY211 pKa = 10.53LGTPPEE217 pKa = 4.63DD218 pKa = 3.54KK219 pKa = 10.79SLLSDD224 pKa = 3.63EE225 pKa = 4.57VLAASNEE232 pKa = 4.07LAPLTGVSVVTEE244 pKa = 4.12DD245 pKa = 3.54TSNGSSDD252 pKa = 3.51VTVTYY257 pKa = 10.67QLGAQPVTAEE267 pKa = 4.12YY268 pKa = 10.99SVLDD272 pKa = 3.94YY273 pKa = 11.45DD274 pKa = 6.1DD275 pKa = 5.75DD276 pKa = 4.71GVWEE280 pKa = 4.14ISGGTGYY287 pKa = 10.52ISTSKK292 pKa = 11.05FEE294 pKa = 4.35GLGLTINGTAVPDD307 pKa = 3.9GDD309 pKa = 3.84EE310 pKa = 4.44VEE312 pKa = 4.6VFPGSYY318 pKa = 10.2QLATTSANFTLSGDD332 pKa = 3.4ATVVVDD338 pKa = 4.76QPFGTADD345 pKa = 3.28TSDD348 pKa = 3.31ITPALTDD355 pKa = 3.2AALQQFRR362 pKa = 11.84GLVRR366 pKa = 11.84AAVEE370 pKa = 4.11GCIASTTLDD379 pKa = 3.96AGCGLAIPATLSDD392 pKa = 3.87GTQLTDD398 pKa = 3.26GTIQRR403 pKa = 11.84TLPADD408 pKa = 3.42TSTTIDD414 pKa = 3.6SLEE417 pKa = 4.03VTLSYY422 pKa = 11.34DD423 pKa = 3.93NPTLAQGEE431 pKa = 4.83SIGGIDD437 pKa = 4.56VSAQCTQGGQTGTCSVLFGPSLGRR461 pKa = 11.84PSVDD465 pKa = 2.8MASPNPTVLWDD476 pKa = 3.39
MM1 pKa = 7.73SDD3 pKa = 3.86DD4 pKa = 4.16RR5 pKa = 11.84NNPGPQQSGEE15 pKa = 4.39DD16 pKa = 3.66GQQPSRR22 pKa = 11.84GADD25 pKa = 3.08RR26 pKa = 11.84TGDD29 pKa = 3.48LPAYY33 pKa = 8.11PVQGQGDD40 pKa = 4.27SGPAFPGYY48 pKa = 9.27PPQGQPGSGVPPQGPQSPNAAPPTGAPQPHH78 pKa = 7.43PGYY81 pKa = 10.03GQPQSPQPHH90 pKa = 7.27PGYY93 pKa = 10.53GPQPPTYY100 pKa = 9.5GQPQGQPPQSGPQPHH115 pKa = 7.39PGYY118 pKa = 10.17GQPQAQTPQWAQGAPNGSGRR138 pKa = 11.84PPKK141 pKa = 10.26KK142 pKa = 10.08GLSVGALIGIIGGGVFLLLVIGVIVAIVVIRR173 pKa = 11.84SVASPAGGGTSQSTSPSQVVTEE195 pKa = 4.22YY196 pKa = 10.02LTAIADD202 pKa = 3.75GDD204 pKa = 3.96AEE206 pKa = 4.28KK207 pKa = 11.04ALGYY211 pKa = 10.53LGTPPEE217 pKa = 4.63DD218 pKa = 3.54KK219 pKa = 10.79SLLSDD224 pKa = 3.63EE225 pKa = 4.57VLAASNEE232 pKa = 4.07LAPLTGVSVVTEE244 pKa = 4.12DD245 pKa = 3.54TSNGSSDD252 pKa = 3.51VTVTYY257 pKa = 10.67QLGAQPVTAEE267 pKa = 4.12YY268 pKa = 10.99SVLDD272 pKa = 3.94YY273 pKa = 11.45DD274 pKa = 6.1DD275 pKa = 5.75DD276 pKa = 4.71GVWEE280 pKa = 4.14ISGGTGYY287 pKa = 10.52ISTSKK292 pKa = 11.05FEE294 pKa = 4.35GLGLTINGTAVPDD307 pKa = 3.9GDD309 pKa = 3.84EE310 pKa = 4.44VEE312 pKa = 4.6VFPGSYY318 pKa = 10.2QLATTSANFTLSGDD332 pKa = 3.4ATVVVDD338 pKa = 4.76QPFGTADD345 pKa = 3.28TSDD348 pKa = 3.31ITPALTDD355 pKa = 3.2AALQQFRR362 pKa = 11.84GLVRR366 pKa = 11.84AAVEE370 pKa = 4.11GCIASTTLDD379 pKa = 3.96AGCGLAIPATLSDD392 pKa = 3.87GTQLTDD398 pKa = 3.26GTIQRR403 pKa = 11.84TLPADD408 pKa = 3.42TSTTIDD414 pKa = 3.6SLEE417 pKa = 4.03VTLSYY422 pKa = 11.34DD423 pKa = 3.93NPTLAQGEE431 pKa = 4.83SIGGIDD437 pKa = 4.56VSAQCTQGGQTGTCSVLFGPSLGRR461 pKa = 11.84PSVDD465 pKa = 2.8MASPNPTVLWDD476 pKa = 3.39
Molecular weight: 48.1 kDa
Isoelectric point according different methods:
Protein with the highest isoelectric point:
>tr|A0A1X9LIW4|A0A1X9LIW4_9MICO Aspartate aminotransferase family protein OS=Cnuibacter physcomitrellae OX=1619308 GN=B5808_07565 PE=3 SV=1
MM1 pKa = 6.76VRR3 pKa = 11.84VVRR6 pKa = 11.84GFRR9 pKa = 11.84LLGVVRR15 pKa = 11.84VVRR18 pKa = 11.84GFRR21 pKa = 11.84LLGVVRR27 pKa = 11.84VVRR30 pKa = 11.84GFGLLGVVRR39 pKa = 11.84VVRR42 pKa = 11.84GFGLLGVVRR51 pKa = 11.84VVRR54 pKa = 11.84GFGLLGVVRR63 pKa = 11.84VVRR66 pKa = 11.84GFGLLGVVMVVRR78 pKa = 11.84GFRR81 pKa = 11.84LLGVLMVVRR90 pKa = 11.84GGSARR95 pKa = 11.84SAWSWWSAGSACSAWW110 pKa = 3.34
MM1 pKa = 6.76VRR3 pKa = 11.84VVRR6 pKa = 11.84GFRR9 pKa = 11.84LLGVVRR15 pKa = 11.84VVRR18 pKa = 11.84GFRR21 pKa = 11.84LLGVVRR27 pKa = 11.84VVRR30 pKa = 11.84GFGLLGVVRR39 pKa = 11.84VVRR42 pKa = 11.84GFGLLGVVRR51 pKa = 11.84VVRR54 pKa = 11.84GFGLLGVVRR63 pKa = 11.84VVRR66 pKa = 11.84GFGLLGVVMVVRR78 pKa = 11.84GFRR81 pKa = 11.84LLGVLMVVRR90 pKa = 11.84GGSARR95 pKa = 11.84SAWSWWSAGSACSAWW110 pKa = 3.34
Molecular weight: 11.85 kDa
Isoelectric point according different methods:
Peptides (in silico digests for buttom-up proteomics)
Below you can find in silico digests of the whole proteome with Trypsin, Chymotrypsin, Trypsin+LysC, LysN, ArgC proteases suitable for different mass spec machines.| Try ESI |
 |
|---|
| ChTry ESI |
 |
|---|
| ArgC ESI |
 |
|---|
| LysN ESI |
 |
|---|
| TryLysC ESI |
 |
|---|
| Try MALDI |
 |
|---|
| ChTry MALDI |
 |
|---|
| ArgC MALDI |
 |
|---|
| LysN MALDI |
 |
|---|
| TryLysC MALDI |
 |
|---|
| Try LTQ |
 |
|---|
| ChTry LTQ |
 |
|---|
| ArgC LTQ |
 |
|---|
| LysN LTQ |
 |
|---|
| TryLysC LTQ |
 |
|---|
| Try MSlow |
 |
|---|
| ChTry MSlow |
 |
|---|
| ArgC MSlow |
 |
|---|
| LysN MSlow |
 |
|---|
| TryLysC MSlow |
 |
|---|
| Try MShigh |
 |
|---|
| ChTry MShigh |
 |
|---|
| ArgC MShigh |
 |
|---|
| LysN MShigh |
 |
|---|
| TryLysC MShigh |
 |
|---|
General Statistics
Number of major isoforms |
Number of additional isoforms |
Number of all proteins |
Number of amino acids |
Min. Seq. Length |
Max. Seq. Length |
Avg. Seq. Length |
Avg. Mol. Weight |
|---|---|---|---|---|---|---|---|
0 |
1285964 |
32 |
2550 |
320.8 |
34.17 |
Amino acid frequency
Ala |
Cys |
Asp |
Glu |
Phe |
Gly |
His |
Ile |
Lys |
Leu |
|---|---|---|---|---|---|---|---|---|---|
13.394 ± 0.055 | 0.485 ± 0.007 |
6.328 ± 0.036 | 5.519 ± 0.039 |
3.008 ± 0.023 | 9.12 ± 0.037 |
1.872 ± 0.02 | 4.3 ± 0.031 |
1.696 ± 0.024 | 10.242 ± 0.044 |
Met |
Asn |
Gln |
Pro |
Arg |
Ser |
Thr |
Val |
Trp |
Tyr |
|---|---|---|---|---|---|---|---|---|---|
1.679 ± 0.013 | 1.756 ± 0.021 |
5.612 ± 0.03 | 2.695 ± 0.023 |
7.306 ± 0.047 | 6.195 ± 0.034 |
6.182 ± 0.043 | 9.171 ± 0.043 |
1.459 ± 0.016 | 1.981 ± 0.019 |
Most of the basic statistics you can see at this page can be downloaded from this CSV file
Proteome-pI is available under Creative Commons Attribution-NoDerivs license, for more details see here
| Reference: Kozlowski LP. Proteome-pI 2.0: Proteome Isoelectric Point Database Update. Nucleic Acids Res. 2021, doi: 10.1093/nar/gkab944 | Contact: Lukasz P. Kozlowski |
