Sporomusa termitida
Taxonomy: cellular organisms; Bacteria; Terrabacteria group; Firmicutes; Negativicutes; Selenomonadales; Sporomusaceae; Sporomusa
Average proteome isoelectric point is 6.63
Get precalculated fractions of proteins

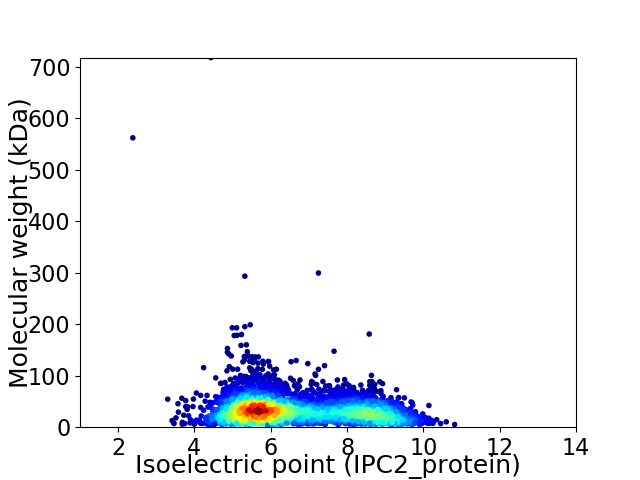
Virtual 2D-PAGE plot for 4716 proteins (isoelectric point calculated using IPC2_protein)
Get csv file with sequences according to given criteria:
* You can choose from 21 different methods for calculating isoelectric point
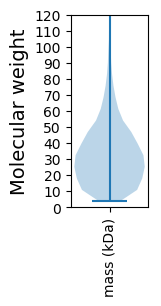
Summary statistics related to proteome-wise predictions


Protein with the lowest isoelectric point:
>tr|A0A517DR56|A0A517DR56_9FIRM TRAP-T-associated universal stress protein TeaD OS=Sporomusa termitida OX=2377 GN=teaD PE=3 SV=1
MM1 pKa = 7.11STTSVSNYY9 pKa = 6.93WKK11 pKa = 9.44TPTTTAADD19 pKa = 3.93TTSTTGTSSLDD30 pKa = 3.35FNDD33 pKa = 4.22FVEE36 pKa = 4.83LLATEE41 pKa = 5.45LRR43 pKa = 11.84YY44 pKa = 9.49QDD46 pKa = 3.73PQDD49 pKa = 3.93PVSSTEE55 pKa = 3.86YY56 pKa = 10.25VAQLAQFGTLDD67 pKa = 3.4KK68 pKa = 11.32LNTIGNSVDD77 pKa = 3.65AYY79 pKa = 10.25QAYY82 pKa = 9.98GLIGKK87 pKa = 8.94SVTYY91 pKa = 8.94ATTDD95 pKa = 3.2AAGAAASATGTVDD108 pKa = 3.2SVSIKK113 pKa = 10.84SGTAYY118 pKa = 11.03LNIGSMQITLSSVSQVAEE136 pKa = 3.97ASSS139 pKa = 3.21
MM1 pKa = 7.11STTSVSNYY9 pKa = 6.93WKK11 pKa = 9.44TPTTTAADD19 pKa = 3.93TTSTTGTSSLDD30 pKa = 3.35FNDD33 pKa = 4.22FVEE36 pKa = 4.83LLATEE41 pKa = 5.45LRR43 pKa = 11.84YY44 pKa = 9.49QDD46 pKa = 3.73PQDD49 pKa = 3.93PVSSTEE55 pKa = 3.86YY56 pKa = 10.25VAQLAQFGTLDD67 pKa = 3.4KK68 pKa = 11.32LNTIGNSVDD77 pKa = 3.65AYY79 pKa = 10.25QAYY82 pKa = 9.98GLIGKK87 pKa = 8.94SVTYY91 pKa = 8.94ATTDD95 pKa = 3.2AAGAAASATGTVDD108 pKa = 3.2SVSIKK113 pKa = 10.84SGTAYY118 pKa = 11.03LNIGSMQITLSSVSQVAEE136 pKa = 3.97ASSS139 pKa = 3.21
Molecular weight: 14.41 kDa
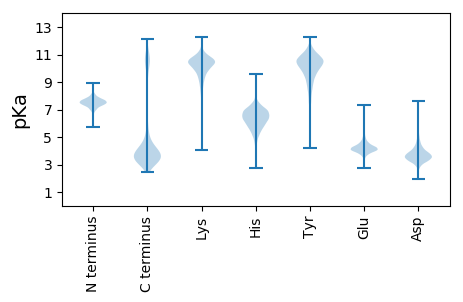
Isoelectric point according different methods:
Protein with the highest isoelectric point:
>tr|A0A517DZF0|A0A517DZF0_9FIRM PhnA: putative alkylphosphonate utilization operon protein PhnA OS=Sporomusa termitida OX=2377 GN=SPTER_41620 PE=3 SV=1
MM1 pKa = 7.26KK2 pKa = 9.38QTTKK6 pKa = 10.28PAPTAQINKK15 pKa = 9.83KK16 pKa = 8.99GRR18 pKa = 11.84PWAAWLIIVAGSGLLVLLMMFSITRR43 pKa = 11.84GAAAIPFFAVGDD55 pKa = 3.75ALVRR59 pKa = 11.84FDD61 pKa = 5.49AKK63 pKa = 9.86NTQHH67 pKa = 7.32LIVLDD72 pKa = 3.77LRR74 pKa = 11.84LPRR77 pKa = 11.84VIASALVGAALAVAGAVMQGTTRR100 pKa = 11.84NPLADD105 pKa = 3.91SGLMGLNAGAGFALSICFAFFPRR128 pKa = 11.84LGYY131 pKa = 8.41MQLILFSFLGAALGAALVGGIASLRR156 pKa = 11.84RR157 pKa = 11.84GGATPMRR164 pKa = 11.84LVLAGAAVSALLAALSQGIALYY186 pKa = 10.55FDD188 pKa = 3.79VAQDD192 pKa = 3.12IMFWTTGGVAAASWEE207 pKa = 4.43QIRR210 pKa = 11.84IMAPWILGALLGSIALARR228 pKa = 11.84SVSLLSLGQDD238 pKa = 3.39VAKK241 pKa = 10.85GLGLNTAVGNGLCFLIVLILAGASVSVVGAVGFVGLIIPHH281 pKa = 6.58LARR284 pKa = 11.84YY285 pKa = 8.2FVGVDD290 pKa = 3.63YY291 pKa = 10.84RR292 pKa = 11.84WVIPSSAVLGALLLVLADD310 pKa = 4.27LGARR314 pKa = 11.84TLNPPFEE321 pKa = 4.43TPIGALIGLIGVPCFLYY338 pKa = 10.58LARR341 pKa = 11.84QQRR344 pKa = 11.84MGLL347 pKa = 3.57
MM1 pKa = 7.26KK2 pKa = 9.38QTTKK6 pKa = 10.28PAPTAQINKK15 pKa = 9.83KK16 pKa = 8.99GRR18 pKa = 11.84PWAAWLIIVAGSGLLVLLMMFSITRR43 pKa = 11.84GAAAIPFFAVGDD55 pKa = 3.75ALVRR59 pKa = 11.84FDD61 pKa = 5.49AKK63 pKa = 9.86NTQHH67 pKa = 7.32LIVLDD72 pKa = 3.77LRR74 pKa = 11.84LPRR77 pKa = 11.84VIASALVGAALAVAGAVMQGTTRR100 pKa = 11.84NPLADD105 pKa = 3.91SGLMGLNAGAGFALSICFAFFPRR128 pKa = 11.84LGYY131 pKa = 8.41MQLILFSFLGAALGAALVGGIASLRR156 pKa = 11.84RR157 pKa = 11.84GGATPMRR164 pKa = 11.84LVLAGAAVSALLAALSQGIALYY186 pKa = 10.55FDD188 pKa = 3.79VAQDD192 pKa = 3.12IMFWTTGGVAAASWEE207 pKa = 4.43QIRR210 pKa = 11.84IMAPWILGALLGSIALARR228 pKa = 11.84SVSLLSLGQDD238 pKa = 3.39VAKK241 pKa = 10.85GLGLNTAVGNGLCFLIVLILAGASVSVVGAVGFVGLIIPHH281 pKa = 6.58LARR284 pKa = 11.84YY285 pKa = 8.2FVGVDD290 pKa = 3.63YY291 pKa = 10.84RR292 pKa = 11.84WVIPSSAVLGALLLVLADD310 pKa = 4.27LGARR314 pKa = 11.84TLNPPFEE321 pKa = 4.43TPIGALIGLIGVPCFLYY338 pKa = 10.58LARR341 pKa = 11.84QQRR344 pKa = 11.84MGLL347 pKa = 3.57
Molecular weight: 35.86 kDa
Isoelectric point according different methods:
Peptides (in silico digests for buttom-up proteomics)
Below you can find in silico digests of the whole proteome with Trypsin, Chymotrypsin, Trypsin+LysC, LysN, ArgC proteases suitable for different mass spec machines.| Try ESI |
 |
|---|
| ChTry ESI |
 |
|---|
| ArgC ESI |
 |
|---|
| LysN ESI |
 |
|---|
| TryLysC ESI |
 |
|---|
| Try MALDI |
 |
|---|
| ChTry MALDI |
 |
|---|
| ArgC MALDI |
 |
|---|
| LysN MALDI |
 |
|---|
| TryLysC MALDI |
 |
|---|
| Try LTQ |
 |
|---|
| ChTry LTQ |
 |
|---|
| ArgC LTQ |
 |
|---|
| LysN LTQ |
 |
|---|
| TryLysC LTQ |
 |
|---|
| Try MSlow |
 |
|---|
| ChTry MSlow |
 |
|---|
| ArgC MSlow |
 |
|---|
| LysN MSlow |
 |
|---|
| TryLysC MSlow |
 |
|---|
| Try MShigh |
 |
|---|
| ChTry MShigh |
 |
|---|
| ArgC MShigh |
 |
|---|
| LysN MShigh |
 |
|---|
| TryLysC MShigh |
 |
|---|
General Statistics
Number of major isoforms |
Number of additional isoforms |
Number of all proteins |
Number of amino acids |
Min. Seq. Length |
Max. Seq. Length |
Avg. Seq. Length |
Avg. Mol. Weight |
|---|---|---|---|---|---|---|---|
0 |
1486555 |
34 |
7221 |
315.2 |
34.57 |
Amino acid frequency
Ala |
Cys |
Asp |
Glu |
Phe |
Gly |
His |
Ile |
Lys |
Leu |
|---|---|---|---|---|---|---|---|---|---|
10.234 ± 0.058 | 1.223 ± 0.018 |
4.762 ± 0.036 | 5.864 ± 0.043 |
3.74 ± 0.032 | 7.994 ± 0.128 |
1.805 ± 0.017 | 7.082 ± 0.034 |
5.266 ± 0.044 | 10.035 ± 0.059 |
Met |
Asn |
Gln |
Pro |
Arg |
Ser |
Thr |
Val |
Trp |
Tyr |
|---|---|---|---|---|---|---|---|---|---|
2.544 ± 0.02 | 3.859 ± 0.033 |
4.142 ± 0.031 | 4.028 ± 0.035 |
4.899 ± 0.036 | 5.237 ± 0.037 |
5.661 ± 0.121 | 7.355 ± 0.037 |
1.019 ± 0.017 | 3.252 ± 0.03 |
Most of the basic statistics you can see at this page can be downloaded from this CSV file
Proteome-pI is available under Creative Commons Attribution-NoDerivs license, for more details see here
| Reference: Kozlowski LP. Proteome-pI 2.0: Proteome Isoelectric Point Database Update. Nucleic Acids Res. 2021, doi: 10.1093/nar/gkab944 | Contact: Lukasz P. Kozlowski |
