Enterococcus asini ATCC 700915
Taxonomy: cellular organisms; Bacteria; Terrabacteria group; Firmicutes; Bacilli; Lactobacillales; Enterococcaceae; Enterococcus; Enterococcus asini
Average proteome isoelectric point is 6.08
Get precalculated fractions of proteins

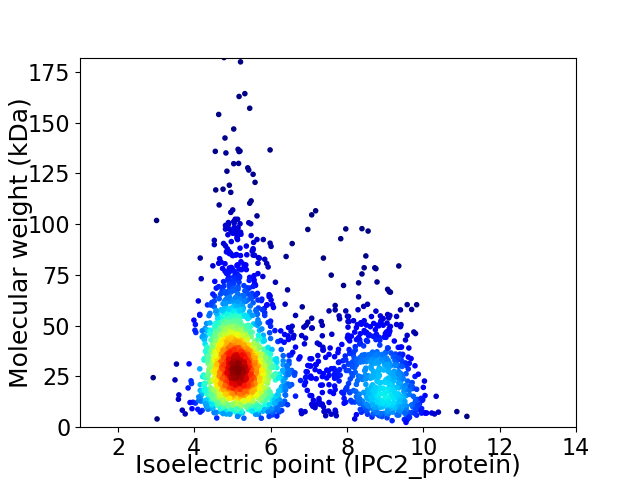
Virtual 2D-PAGE plot for 2389 proteins (isoelectric point calculated using IPC2_protein)
Get csv file with sequences according to given criteria:
* You can choose from 21 different methods for calculating isoelectric point
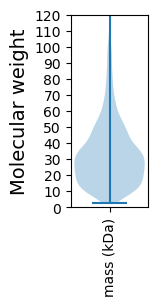
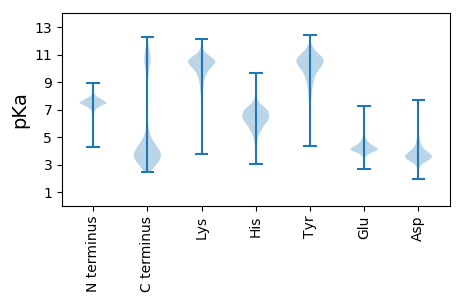
Summary statistics related to proteome-wise predictions


Protein with the lowest isoelectric point:
>tr|R2PXA6|R2PXA6_9ENTE Uncharacterized protein OS=Enterococcus asini ATCC 700915 OX=1158606 GN=UAS_00631 PE=4 SV=1
MM1 pKa = 7.44KK2 pKa = 10.09LIKK5 pKa = 10.47SILFGTAVLAGVAAFGSQSDD25 pKa = 3.6AAEE28 pKa = 4.22IEE30 pKa = 4.42HH31 pKa = 6.43TVTSSDD37 pKa = 4.0TLWGLSMKK45 pKa = 10.72YY46 pKa = 10.17YY47 pKa = 10.93GSDD50 pKa = 4.37DD51 pKa = 4.24YY52 pKa = 11.53IQTIANDD59 pKa = 3.79NNIEE63 pKa = 4.11NADD66 pKa = 3.89MIYY69 pKa = 10.68DD70 pKa = 4.03GEE72 pKa = 4.31VLKK75 pKa = 11.01INTDD79 pKa = 3.36SPAATAAQTEE89 pKa = 4.58TPKK92 pKa = 10.92AVAEE96 pKa = 4.5TTTEE100 pKa = 3.8AAPAEE105 pKa = 4.17TSEE108 pKa = 4.31PVTTTTEE115 pKa = 3.73EE116 pKa = 3.96ANYY119 pKa = 10.58SGTTMYY125 pKa = 10.07MEE127 pKa = 4.56ATAYY131 pKa = 10.85SSDD134 pKa = 3.62PADD137 pKa = 3.65ALGGGTVTATGQNLLEE153 pKa = 4.5NPMAVAVDD161 pKa = 3.82PSVIPLGTHH170 pKa = 7.02LYY172 pKa = 9.73VEE174 pKa = 5.63GYY176 pKa = 10.01GEE178 pKa = 4.76AYY180 pKa = 10.25AVDD183 pKa = 3.91TGSAIQGNIIDD194 pKa = 4.06VHH196 pKa = 6.01FSSYY200 pKa = 9.73DD201 pKa = 3.16QCVAWGRR208 pKa = 11.84RR209 pKa = 11.84QVKK212 pKa = 7.72VTILDD217 pKa = 3.46
MM1 pKa = 7.44KK2 pKa = 10.09LIKK5 pKa = 10.47SILFGTAVLAGVAAFGSQSDD25 pKa = 3.6AAEE28 pKa = 4.22IEE30 pKa = 4.42HH31 pKa = 6.43TVTSSDD37 pKa = 4.0TLWGLSMKK45 pKa = 10.72YY46 pKa = 10.17YY47 pKa = 10.93GSDD50 pKa = 4.37DD51 pKa = 4.24YY52 pKa = 11.53IQTIANDD59 pKa = 3.79NNIEE63 pKa = 4.11NADD66 pKa = 3.89MIYY69 pKa = 10.68DD70 pKa = 4.03GEE72 pKa = 4.31VLKK75 pKa = 11.01INTDD79 pKa = 3.36SPAATAAQTEE89 pKa = 4.58TPKK92 pKa = 10.92AVAEE96 pKa = 4.5TTTEE100 pKa = 3.8AAPAEE105 pKa = 4.17TSEE108 pKa = 4.31PVTTTTEE115 pKa = 3.73EE116 pKa = 3.96ANYY119 pKa = 10.58SGTTMYY125 pKa = 10.07MEE127 pKa = 4.56ATAYY131 pKa = 10.85SSDD134 pKa = 3.62PADD137 pKa = 3.65ALGGGTVTATGQNLLEE153 pKa = 4.5NPMAVAVDD161 pKa = 3.82PSVIPLGTHH170 pKa = 7.02LYY172 pKa = 9.73VEE174 pKa = 5.63GYY176 pKa = 10.01GEE178 pKa = 4.76AYY180 pKa = 10.25AVDD183 pKa = 3.91TGSAIQGNIIDD194 pKa = 4.06VHH196 pKa = 6.01FSSYY200 pKa = 9.73DD201 pKa = 3.16QCVAWGRR208 pKa = 11.84RR209 pKa = 11.84QVKK212 pKa = 7.72VTILDD217 pKa = 3.46
Molecular weight: 22.84 kDa
Isoelectric point according different methods:
Protein with the highest isoelectric point:
>tr|R2S995|R2S995_9ENTE 2-amino-4-hydroxy-6-hydroxymethyldihydropteridine pyrophosphokinase OS=Enterococcus asini ATCC 700915 OX=1158606 GN=UAS_00520 PE=4 SV=1
MM1 pKa = 7.35KK2 pKa = 9.42RR3 pKa = 11.84TYY5 pKa = 10.34QPNKK9 pKa = 9.16RR10 pKa = 11.84KK11 pKa = 9.12RR12 pKa = 11.84QKK14 pKa = 9.38VHH16 pKa = 5.8GFRR19 pKa = 11.84KK20 pKa = 10.04RR21 pKa = 11.84MSTKK25 pKa = 9.54NGRR28 pKa = 11.84RR29 pKa = 11.84VIAARR34 pKa = 11.84RR35 pKa = 11.84RR36 pKa = 11.84KK37 pKa = 8.85GRR39 pKa = 11.84KK40 pKa = 8.75VLAAA44 pKa = 4.31
MM1 pKa = 7.35KK2 pKa = 9.42RR3 pKa = 11.84TYY5 pKa = 10.34QPNKK9 pKa = 9.16RR10 pKa = 11.84KK11 pKa = 9.12RR12 pKa = 11.84QKK14 pKa = 9.38VHH16 pKa = 5.8GFRR19 pKa = 11.84KK20 pKa = 10.04RR21 pKa = 11.84MSTKK25 pKa = 9.54NGRR28 pKa = 11.84RR29 pKa = 11.84VIAARR34 pKa = 11.84RR35 pKa = 11.84RR36 pKa = 11.84KK37 pKa = 8.85GRR39 pKa = 11.84KK40 pKa = 8.75VLAAA44 pKa = 4.31
Molecular weight: 5.32 kDa
Isoelectric point according different methods:
Peptides (in silico digests for buttom-up proteomics)
Below you can find in silico digests of the whole proteome with Trypsin, Chymotrypsin, Trypsin+LysC, LysN, ArgC proteases suitable for different mass spec machines.| Try ESI |
 |
|---|
| ChTry ESI |
 |
|---|
| ArgC ESI |
 |
|---|
| LysN ESI |
 |
|---|
| TryLysC ESI |
 |
|---|
| Try MALDI |
 |
|---|
| ChTry MALDI |
 |
|---|
| ArgC MALDI |
 |
|---|
| LysN MALDI |
 |
|---|
| TryLysC MALDI |
 |
|---|
| Try LTQ |
 |
|---|
| ChTry LTQ |
 |
|---|
| ArgC LTQ |
 |
|---|
| LysN LTQ |
 |
|---|
| TryLysC LTQ |
 |
|---|
| Try MSlow |
 |
|---|
| ChTry MSlow |
 |
|---|
| ArgC MSlow |
 |
|---|
| LysN MSlow |
 |
|---|
| TryLysC MSlow |
 |
|---|
| Try MShigh |
 |
|---|
| ChTry MShigh |
 |
|---|
| ArgC MShigh |
 |
|---|
| LysN MShigh |
 |
|---|
| TryLysC MShigh |
 |
|---|
General Statistics
Number of major isoforms |
Number of additional isoforms |
Number of all proteins |
Number of amino acids |
Min. Seq. Length |
Max. Seq. Length |
Avg. Seq. Length |
Avg. Mol. Weight |
|---|---|---|---|---|---|---|---|
0 |
736464 |
22 |
1672 |
308.3 |
34.41 |
Amino acid frequency
Ala |
Cys |
Asp |
Glu |
Phe |
Gly |
His |
Ile |
Lys |
Leu |
|---|---|---|---|---|---|---|---|---|---|
8.297 ± 0.058 | 0.683 ± 0.015 |
5.376 ± 0.058 | 7.2 ± 0.049 |
4.452 ± 0.04 | 7.03 ± 0.048 |
1.861 ± 0.019 | 6.568 ± 0.044 |
6.112 ± 0.039 | 10.335 ± 0.063 |
Met |
Asn |
Gln |
Pro |
Arg |
Ser |
Thr |
Val |
Trp |
Tyr |
|---|---|---|---|---|---|---|---|---|---|
2.593 ± 0.024 | 3.982 ± 0.034 |
3.781 ± 0.028 | 4.594 ± 0.049 |
4.142 ± 0.039 | 5.459 ± 0.044 |
5.837 ± 0.037 | 7.097 ± 0.038 |
0.992 ± 0.016 | 3.609 ± 0.031 |
Most of the basic statistics you can see at this page can be downloaded from this CSV file
Proteome-pI is available under Creative Commons Attribution-NoDerivs license, for more details see here
| Reference: Kozlowski LP. Proteome-pI 2.0: Proteome Isoelectric Point Database Update. Nucleic Acids Res. 2021, doi: 10.1093/nar/gkab944 | Contact: Lukasz P. Kozlowski |
