Flavobacteriaceae bacterium MAR_2010_72
Taxonomy: cellular organisms; Bacteria; FCB group; Bacteroidetes/Chlorobi group; Bacteroidetes; Flavobacteriia; Flavobacteriales; Flavobacteriaceae; unclassified Flavobacteriaceae
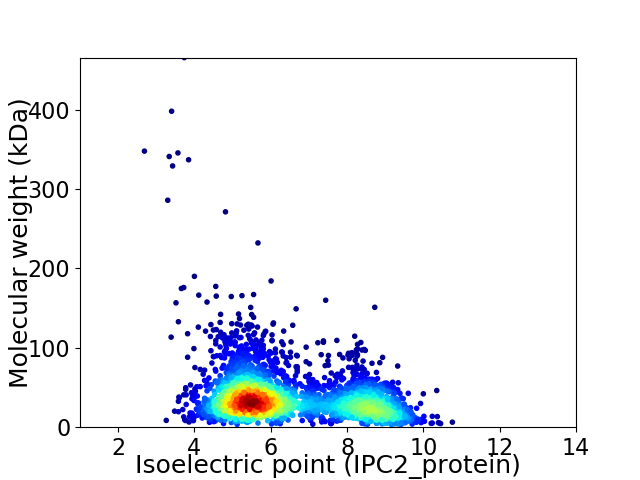
Average proteome isoelectric point is 6.44
Get precalculated fractions of proteins

Virtual 2D-PAGE plot for 2943 proteins (isoelectric point calculated using IPC2_protein)
Get csv file with sequences according to given criteria:
* You can choose from 21 different methods for calculating isoelectric point
Summary statistics related to proteome-wise predictions


Protein with the lowest isoelectric point:
>tr|A0A397L7I9|A0A397L7I9_9FLAO Uncharacterized protein OS=Flavobacteriaceae bacterium MAR_2010_72 OX=1250029 GN=OE09_0180 PE=4 SV=1
MM1 pKa = 7.57KK2 pKa = 10.05SIKK5 pKa = 10.04ILTVLILALIGFNSCEE21 pKa = 3.96KK22 pKa = 10.95DD23 pKa = 3.32EE24 pKa = 5.02LVFTAQEE31 pKa = 3.81QGEE34 pKa = 4.5FTFTNTFLAQYY45 pKa = 9.45ILTSTASANIGEE57 pKa = 4.54RR58 pKa = 11.84FTWTSVNFDD67 pKa = 3.3VPTAVSYY74 pKa = 10.82DD75 pKa = 3.72LQGSISGDD83 pKa = 3.47FTDD86 pKa = 3.65MTVIGSTSGNDD97 pKa = 2.97IAVTIGKK104 pKa = 9.06LMSMATTAGLDD115 pKa = 3.34NDD117 pKa = 4.97PNTEE121 pKa = 4.0NPNTGQLFFRR131 pKa = 11.84LRR133 pKa = 11.84AYY135 pKa = 10.28AGNDD139 pKa = 3.45AIEE142 pKa = 4.47TLSSVQSLTVVLPEE156 pKa = 4.03IVDD159 pKa = 3.6TGGSGITVSNWGVVGSAYY177 pKa = 10.64NDD179 pKa = 3.3WGNAGLDD186 pKa = 3.45GAFYY190 pKa = 9.87STNNPDD196 pKa = 3.61VIVSYY201 pKa = 9.63VTLLAGAMKK210 pKa = 10.25FRR212 pKa = 11.84LDD214 pKa = 3.89NDD216 pKa = 3.1WTTNYY221 pKa = 10.05GDD223 pKa = 3.71NGADD227 pKa = 3.43GTLEE231 pKa = 3.97EE232 pKa = 4.89GGADD236 pKa = 2.71IVVTAGTYY244 pKa = 10.28KK245 pKa = 9.45ITVDD249 pKa = 3.92TNAKK253 pKa = 7.97TYY255 pKa = 9.92TMEE258 pKa = 4.73PYY260 pKa = 10.31AWGIVGSAYY269 pKa = 10.69NDD271 pKa = 3.38WGNAGPDD278 pKa = 2.96AKK280 pKa = 10.54LYY282 pKa = 10.83YY283 pKa = 10.35DD284 pKa = 3.67YY285 pKa = 8.48TTDD288 pKa = 3.27TFKK291 pKa = 11.38VGVKK295 pKa = 10.5LLDD298 pKa = 3.54GAMKK302 pKa = 10.3FRR304 pKa = 11.84FNNDD308 pKa = 1.68WTTNYY313 pKa = 10.41GDD315 pKa = 3.63TGADD319 pKa = 3.33GSLDD323 pKa = 3.59EE324 pKa = 5.49GGDD327 pKa = 4.06DD328 pKa = 3.94IIVTAGHH335 pKa = 5.78YY336 pKa = 10.74NITFDD341 pKa = 4.71LNNGEE346 pKa = 4.15YY347 pKa = 10.09SIEE350 pKa = 4.08SAEE353 pKa = 3.92VLGIVGSAYY362 pKa = 10.71NDD364 pKa = 3.52WGNGGPDD371 pKa = 3.58FSLTQVSPDD380 pKa = 3.35IYY382 pKa = 11.04VGDD385 pKa = 3.83IATLIGGAMKK395 pKa = 10.34FRR397 pKa = 11.84VNNDD401 pKa = 1.96WTTNYY406 pKa = 10.41GDD408 pKa = 3.59TGADD412 pKa = 3.31GVLDD416 pKa = 4.21AGGDD420 pKa = 4.14DD421 pKa = 3.45IVVTAGKK428 pKa = 10.02YY429 pKa = 8.44RR430 pKa = 11.84VRR432 pKa = 11.84IDD434 pKa = 3.83LTDD437 pKa = 3.42GSYY440 pKa = 9.53TLNKK444 pKa = 9.24IQQ446 pKa = 4.41
MM1 pKa = 7.57KK2 pKa = 10.05SIKK5 pKa = 10.04ILTVLILALIGFNSCEE21 pKa = 3.96KK22 pKa = 10.95DD23 pKa = 3.32EE24 pKa = 5.02LVFTAQEE31 pKa = 3.81QGEE34 pKa = 4.5FTFTNTFLAQYY45 pKa = 9.45ILTSTASANIGEE57 pKa = 4.54RR58 pKa = 11.84FTWTSVNFDD67 pKa = 3.3VPTAVSYY74 pKa = 10.82DD75 pKa = 3.72LQGSISGDD83 pKa = 3.47FTDD86 pKa = 3.65MTVIGSTSGNDD97 pKa = 2.97IAVTIGKK104 pKa = 9.06LMSMATTAGLDD115 pKa = 3.34NDD117 pKa = 4.97PNTEE121 pKa = 4.0NPNTGQLFFRR131 pKa = 11.84LRR133 pKa = 11.84AYY135 pKa = 10.28AGNDD139 pKa = 3.45AIEE142 pKa = 4.47TLSSVQSLTVVLPEE156 pKa = 4.03IVDD159 pKa = 3.6TGGSGITVSNWGVVGSAYY177 pKa = 10.64NDD179 pKa = 3.3WGNAGLDD186 pKa = 3.45GAFYY190 pKa = 9.87STNNPDD196 pKa = 3.61VIVSYY201 pKa = 9.63VTLLAGAMKK210 pKa = 10.25FRR212 pKa = 11.84LDD214 pKa = 3.89NDD216 pKa = 3.1WTTNYY221 pKa = 10.05GDD223 pKa = 3.71NGADD227 pKa = 3.43GTLEE231 pKa = 3.97EE232 pKa = 4.89GGADD236 pKa = 2.71IVVTAGTYY244 pKa = 10.28KK245 pKa = 9.45ITVDD249 pKa = 3.92TNAKK253 pKa = 7.97TYY255 pKa = 9.92TMEE258 pKa = 4.73PYY260 pKa = 10.31AWGIVGSAYY269 pKa = 10.69NDD271 pKa = 3.38WGNAGPDD278 pKa = 2.96AKK280 pKa = 10.54LYY282 pKa = 10.83YY283 pKa = 10.35DD284 pKa = 3.67YY285 pKa = 8.48TTDD288 pKa = 3.27TFKK291 pKa = 11.38VGVKK295 pKa = 10.5LLDD298 pKa = 3.54GAMKK302 pKa = 10.3FRR304 pKa = 11.84FNNDD308 pKa = 1.68WTTNYY313 pKa = 10.41GDD315 pKa = 3.63TGADD319 pKa = 3.33GSLDD323 pKa = 3.59EE324 pKa = 5.49GGDD327 pKa = 4.06DD328 pKa = 3.94IIVTAGHH335 pKa = 5.78YY336 pKa = 10.74NITFDD341 pKa = 4.71LNNGEE346 pKa = 4.15YY347 pKa = 10.09SIEE350 pKa = 4.08SAEE353 pKa = 3.92VLGIVGSAYY362 pKa = 10.71NDD364 pKa = 3.52WGNGGPDD371 pKa = 3.58FSLTQVSPDD380 pKa = 3.35IYY382 pKa = 11.04VGDD385 pKa = 3.83IATLIGGAMKK395 pKa = 10.34FRR397 pKa = 11.84VNNDD401 pKa = 1.96WTTNYY406 pKa = 10.41GDD408 pKa = 3.59TGADD412 pKa = 3.31GVLDD416 pKa = 4.21AGGDD420 pKa = 4.14DD421 pKa = 3.45IVVTAGKK428 pKa = 10.02YY429 pKa = 8.44RR430 pKa = 11.84VRR432 pKa = 11.84IDD434 pKa = 3.83LTDD437 pKa = 3.42GSYY440 pKa = 9.53TLNKK444 pKa = 9.24IQQ446 pKa = 4.41
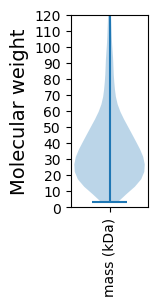
Molecular weight: 47.64 kDa
Isoelectric point according different methods:
Protein with the highest isoelectric point:
>tr|A0A397LES0|A0A397LES0_9FLAO O-antigen ligase-like membrane protein OS=Flavobacteriaceae bacterium MAR_2010_72 OX=1250029 GN=OE09_2104 PE=4 SV=1
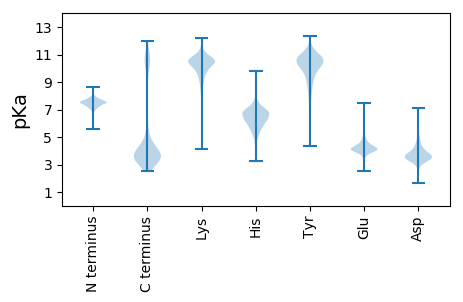
MM1 pKa = 7.69SKK3 pKa = 9.01RR4 pKa = 11.84TFQPSKK10 pKa = 9.13RR11 pKa = 11.84KK12 pKa = 9.48RR13 pKa = 11.84RR14 pKa = 11.84NKK16 pKa = 9.49HH17 pKa = 3.94GFRR20 pKa = 11.84EE21 pKa = 4.19RR22 pKa = 11.84MATANGRR29 pKa = 11.84KK30 pKa = 8.93VLARR34 pKa = 11.84RR35 pKa = 11.84RR36 pKa = 11.84AKK38 pKa = 10.09GRR40 pKa = 11.84KK41 pKa = 8.0KK42 pKa = 10.65LSVSTEE48 pKa = 3.95SRR50 pKa = 11.84HH51 pKa = 6.01KK52 pKa = 10.6KK53 pKa = 9.6
MM1 pKa = 7.69SKK3 pKa = 9.01RR4 pKa = 11.84TFQPSKK10 pKa = 9.13RR11 pKa = 11.84KK12 pKa = 9.48RR13 pKa = 11.84RR14 pKa = 11.84NKK16 pKa = 9.49HH17 pKa = 3.94GFRR20 pKa = 11.84EE21 pKa = 4.19RR22 pKa = 11.84MATANGRR29 pKa = 11.84KK30 pKa = 8.93VLARR34 pKa = 11.84RR35 pKa = 11.84RR36 pKa = 11.84AKK38 pKa = 10.09GRR40 pKa = 11.84KK41 pKa = 8.0KK42 pKa = 10.65LSVSTEE48 pKa = 3.95SRR50 pKa = 11.84HH51 pKa = 6.01KK52 pKa = 10.6KK53 pKa = 9.6
Molecular weight: 6.34 kDa
Isoelectric point according different methods:
Peptides (in silico digests for buttom-up proteomics)
Below you can find in silico digests of the whole proteome with Trypsin, Chymotrypsin, Trypsin+LysC, LysN, ArgC proteases suitable for different mass spec machines.| Try ESI |
 |
|---|
| ChTry ESI |
 |
|---|
| ArgC ESI |
 |
|---|
| LysN ESI |
 |
|---|
| TryLysC ESI |
 |
|---|
| Try MALDI |
 |
|---|
| ChTry MALDI |
 |
|---|
| ArgC MALDI |
 |
|---|
| LysN MALDI |
 |
|---|
| TryLysC MALDI |
 |
|---|
| Try LTQ |
 |
|---|
| ChTry LTQ |
 |
|---|
| ArgC LTQ |
 |
|---|
| LysN LTQ |
 |
|---|
| TryLysC LTQ |
 |
|---|
| Try MSlow |
 |
|---|
| ChTry MSlow |
 |
|---|
| ArgC MSlow |
 |
|---|
| LysN MSlow |
 |
|---|
| TryLysC MSlow |
 |
|---|
| Try MShigh |
 |
|---|
| ChTry MShigh |
 |
|---|
| ArgC MShigh |
 |
|---|
| LysN MShigh |
 |
|---|
| TryLysC MShigh |
 |
|---|
General Statistics
Number of major isoforms |
Number of additional isoforms |
Number of all proteins |
Number of amino acids |
Min. Seq. Length |
Max. Seq. Length |
Avg. Seq. Length |
Avg. Mol. Weight |
|---|---|---|---|---|---|---|---|
0 |
1037183 |
30 |
4502 |
352.4 |
39.66 |
Amino acid frequency
Ala |
Cys |
Asp |
Glu |
Phe |
Gly |
His |
Ile |
Lys |
Leu |
|---|---|---|---|---|---|---|---|---|---|
6.467 ± 0.049 | 0.785 ± 0.026 |
5.808 ± 0.062 | 6.218 ± 0.048 |
5.154 ± 0.039 | 6.482 ± 0.053 |
1.867 ± 0.023 | 7.875 ± 0.037 |
7.301 ± 0.067 | 9.329 ± 0.061 |
Met |
Asn |
Gln |
Pro |
Arg |
Ser |
Thr |
Val |
Trp |
Tyr |
|---|---|---|---|---|---|---|---|---|---|
2.154 ± 0.023 | 6.254 ± 0.046 |
3.476 ± 0.029 | 3.473 ± 0.026 |
3.362 ± 0.028 | 6.567 ± 0.039 |
6.021 ± 0.073 | 6.273 ± 0.034 |
1.088 ± 0.016 | 4.046 ± 0.03 |
Most of the basic statistics you can see at this page can be downloaded from this CSV file
Proteome-pI is available under Creative Commons Attribution-NoDerivs license, for more details see here
| Reference: Kozlowski LP. Proteome-pI 2.0: Proteome Isoelectric Point Database Update. Nucleic Acids Res. 2021, doi: 10.1093/nar/gkab944 | Contact: Lukasz P. Kozlowski |
