Cafeteria roenbergensis virus (strain BV-PW1) (CroV)
Taxonomy: Viruses; Varidnaviria; Bamfordvirae; Nucleocytoviricota; Megaviricetes; Imitervirales; Mimiviridae; Cafeteriavirus; Cafeteria roenbergensis virus
Average proteome isoelectric point is 7.26
Get precalculated fractions of proteins

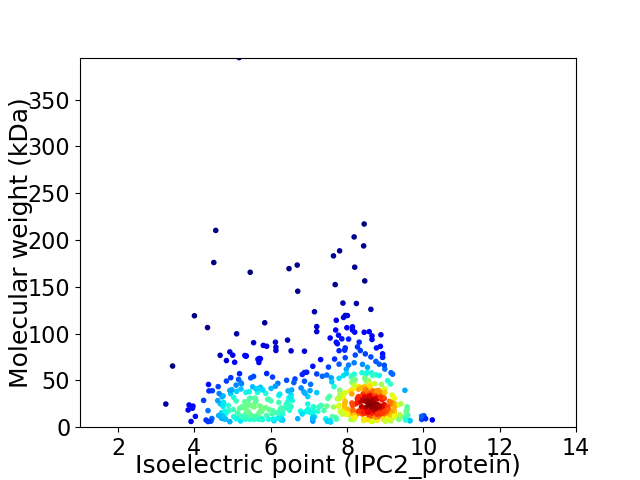
Virtual 2D-PAGE plot for 544 proteins (isoelectric point calculated using IPC2_protein)
Get csv file with sequences according to given criteria:
* You can choose from 21 different methods for calculating isoelectric point
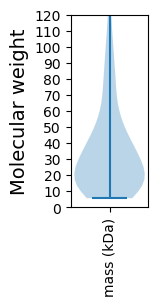
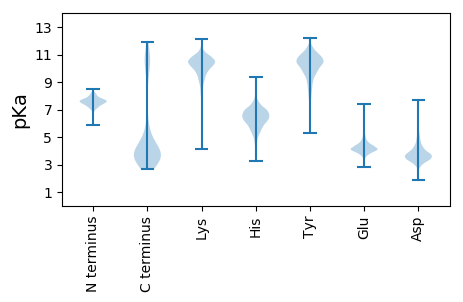
Summary statistics related to proteome-wise predictions


Protein with the lowest isoelectric point:
>tr|E3T4M9|E3T4M9_CROVB ATP-dependent helicase VETFS OS=Cafeteria roenbergensis virus (strain BV-PW1) OX=693272 GN=crov109 PE=3 SV=1
MM1 pKa = 6.99FFEE4 pKa = 5.19YY5 pKa = 9.17ITLTHH10 pKa = 7.19LAQFALKK17 pKa = 10.13HH18 pKa = 6.26HH19 pKa = 6.68ILSDD23 pKa = 3.47FWYY26 pKa = 8.33MGLSIFEE33 pKa = 4.13YY34 pKa = 10.45LFRR37 pKa = 11.84TIFIGMLLPINLYY50 pKa = 10.15GNRR53 pKa = 11.84LAFIKK58 pKa = 9.78FIIIIILLLNSFNNGLDD75 pKa = 3.63FYY77 pKa = 11.5FNDD80 pKa = 3.58TFGFYY85 pKa = 10.38PFQAVFGFWIIGLFINSIINNIISSTQTDD114 pKa = 4.44RR115 pKa = 11.84INYY118 pKa = 8.78DD119 pKa = 3.17NNTYY123 pKa = 10.15FYY125 pKa = 11.34DD126 pKa = 4.03MEE128 pKa = 6.61DD129 pKa = 3.46STIKK133 pKa = 8.87PTNISTEE140 pKa = 3.85EE141 pKa = 3.94STEE144 pKa = 3.89EE145 pKa = 3.81STEE148 pKa = 3.93EE149 pKa = 3.78STEE152 pKa = 3.92EE153 pKa = 3.78LNEE156 pKa = 3.96EE157 pKa = 4.28SNEE160 pKa = 3.89EE161 pKa = 3.99STEE164 pKa = 3.89EE165 pKa = 3.88STEE168 pKa = 3.89EE169 pKa = 4.0SIEE172 pKa = 4.05EE173 pKa = 4.2STEE176 pKa = 3.77EE177 pKa = 4.02TTEE180 pKa = 3.89EE181 pKa = 4.0TTEE184 pKa = 3.99EE185 pKa = 4.06SSEE188 pKa = 4.1KK189 pKa = 10.79LNEE192 pKa = 3.85
MM1 pKa = 6.99FFEE4 pKa = 5.19YY5 pKa = 9.17ITLTHH10 pKa = 7.19LAQFALKK17 pKa = 10.13HH18 pKa = 6.26HH19 pKa = 6.68ILSDD23 pKa = 3.47FWYY26 pKa = 8.33MGLSIFEE33 pKa = 4.13YY34 pKa = 10.45LFRR37 pKa = 11.84TIFIGMLLPINLYY50 pKa = 10.15GNRR53 pKa = 11.84LAFIKK58 pKa = 9.78FIIIIILLLNSFNNGLDD75 pKa = 3.63FYY77 pKa = 11.5FNDD80 pKa = 3.58TFGFYY85 pKa = 10.38PFQAVFGFWIIGLFINSIINNIISSTQTDD114 pKa = 4.44RR115 pKa = 11.84INYY118 pKa = 8.78DD119 pKa = 3.17NNTYY123 pKa = 10.15FYY125 pKa = 11.34DD126 pKa = 4.03MEE128 pKa = 6.61DD129 pKa = 3.46STIKK133 pKa = 8.87PTNISTEE140 pKa = 3.85EE141 pKa = 3.94STEE144 pKa = 3.89EE145 pKa = 3.81STEE148 pKa = 3.93EE149 pKa = 3.78STEE152 pKa = 3.92EE153 pKa = 3.78LNEE156 pKa = 3.96EE157 pKa = 4.28SNEE160 pKa = 3.89EE161 pKa = 3.99STEE164 pKa = 3.89EE165 pKa = 3.88STEE168 pKa = 3.89EE169 pKa = 4.0SIEE172 pKa = 4.05EE173 pKa = 4.2STEE176 pKa = 3.77EE177 pKa = 4.02TTEE180 pKa = 3.89EE181 pKa = 4.0TTEE184 pKa = 3.99EE185 pKa = 4.06SSEE188 pKa = 4.1KK189 pKa = 10.79LNEE192 pKa = 3.85
Molecular weight: 22.52 kDa
Isoelectric point according different methods:
Protein with the highest isoelectric point:
>tr|E3T5V9|E3T5V9_CROVB Uncharacterized protein OS=Cafeteria roenbergensis virus (strain BV-PW1) OX=693272 GN=crov538 PE=4 SV=1
MM1 pKa = 8.07PYY3 pKa = 9.19TRR5 pKa = 11.84KK6 pKa = 10.45NNTRR10 pKa = 11.84NSKK13 pKa = 9.32HH14 pKa = 6.44RR15 pKa = 11.84KK16 pKa = 6.59PKK18 pKa = 10.41KK19 pKa = 9.85NLFQKK24 pKa = 10.52RR25 pKa = 11.84LSKK28 pKa = 10.55EE29 pKa = 4.0FYY31 pKa = 10.55EE32 pKa = 4.4SFTYY36 pKa = 10.39DD37 pKa = 2.7SYY39 pKa = 11.29LAQMTSNPKK48 pKa = 10.15LFSNLFMMKK57 pKa = 9.84LRR59 pKa = 11.84SGFPPSQNILKK70 pKa = 10.24RR71 pKa = 11.84VMEE74 pKa = 4.47SKK76 pKa = 10.83NPDD79 pKa = 3.3MQPVRR84 pKa = 11.84NFIEE88 pKa = 4.23YY89 pKa = 10.93NRR91 pKa = 11.84MQFKK95 pKa = 10.46NN96 pKa = 3.46
MM1 pKa = 8.07PYY3 pKa = 9.19TRR5 pKa = 11.84KK6 pKa = 10.45NNTRR10 pKa = 11.84NSKK13 pKa = 9.32HH14 pKa = 6.44RR15 pKa = 11.84KK16 pKa = 6.59PKK18 pKa = 10.41KK19 pKa = 9.85NLFQKK24 pKa = 10.52RR25 pKa = 11.84LSKK28 pKa = 10.55EE29 pKa = 4.0FYY31 pKa = 10.55EE32 pKa = 4.4SFTYY36 pKa = 10.39DD37 pKa = 2.7SYY39 pKa = 11.29LAQMTSNPKK48 pKa = 10.15LFSNLFMMKK57 pKa = 9.84LRR59 pKa = 11.84SGFPPSQNILKK70 pKa = 10.24RR71 pKa = 11.84VMEE74 pKa = 4.47SKK76 pKa = 10.83NPDD79 pKa = 3.3MQPVRR84 pKa = 11.84NFIEE88 pKa = 4.23YY89 pKa = 10.93NRR91 pKa = 11.84MQFKK95 pKa = 10.46NN96 pKa = 3.46
Molecular weight: 11.71 kDa
Isoelectric point according different methods:
Peptides (in silico digests for buttom-up proteomics)
Below you can find in silico digests of the whole proteome with Trypsin, Chymotrypsin, Trypsin+LysC, LysN, ArgC proteases suitable for different mass spec machines.| Try ESI |
 |
|---|
| ChTry ESI |
 |
|---|
| ArgC ESI |
 |
|---|
| LysN ESI |
 |
|---|
| TryLysC ESI |
 |
|---|
| Try MALDI |
 |
|---|
| ChTry MALDI |
 |
|---|
| ArgC MALDI |
 |
|---|
| LysN MALDI |
 |
|---|
| TryLysC MALDI |
 |
|---|
| Try LTQ |
 |
|---|
| ChTry LTQ |
 |
|---|
| ArgC LTQ |
 |
|---|
| LysN LTQ |
 |
|---|
| TryLysC LTQ |
 |
|---|
| Try MSlow |
 |
|---|
| ChTry MSlow |
 |
|---|
| ArgC MSlow |
 |
|---|
| LysN MSlow |
 |
|---|
| TryLysC MSlow |
 |
|---|
| Try MShigh |
 |
|---|
| ChTry MShigh |
 |
|---|
| ArgC MShigh |
 |
|---|
| LysN MShigh |
 |
|---|
| TryLysC MShigh |
 |
|---|
General Statistics
Number of major isoforms |
Number of additional isoforms |
Number of all proteins |
Number of amino acids |
Min. Seq. Length |
Max. Seq. Length |
Avg. Seq. Length |
Avg. Mol. Weight |
|---|---|---|---|---|---|---|---|
0 |
184963 |
47 |
3337 |
340.0 |
39.61 |
Amino acid frequency
Ala |
Cys |
Asp |
Glu |
Phe |
Gly |
His |
Ile |
Lys |
Leu |
|---|---|---|---|---|---|---|---|---|---|
2.592 ± 0.125 | 1.249 ± 0.048 |
5.698 ± 0.089 | 6.099 ± 0.088 |
5.145 ± 0.083 | 3.834 ± 0.096 |
1.94 ± 0.045 | 10.21 ± 0.139 |
10.383 ± 0.137 | 9.581 ± 0.107 |
Met |
Asn |
Gln |
Pro |
Arg |
Ser |
Thr |
Val |
Trp |
Tyr |
|---|---|---|---|---|---|---|---|---|---|
1.936 ± 0.053 | 9.741 ± 0.183 |
3.513 ± 0.084 | 3.216 ± 0.056 |
2.388 ± 0.067 | 6.333 ± 0.102 |
5.856 ± 0.094 | 4.051 ± 0.071 |
0.907 ± 0.043 | 5.327 ± 0.087 |
Most of the basic statistics you can see at this page can be downloaded from this CSV file
Proteome-pI is available under Creative Commons Attribution-NoDerivs license, for more details see here
| Reference: Kozlowski LP. Proteome-pI 2.0: Proteome Isoelectric Point Database Update. Nucleic Acids Res. 2021, doi: 10.1093/nar/gkab944 | Contact: Lukasz P. Kozlowski |
