Erysipelothrix larvae
Taxonomy: cellular organisms; Bacteria; Terrabacteria group; Firmicutes; Erysipelotrichia; Erysipelotrichales; Erysipelotrichaceae; Erysipelothrix
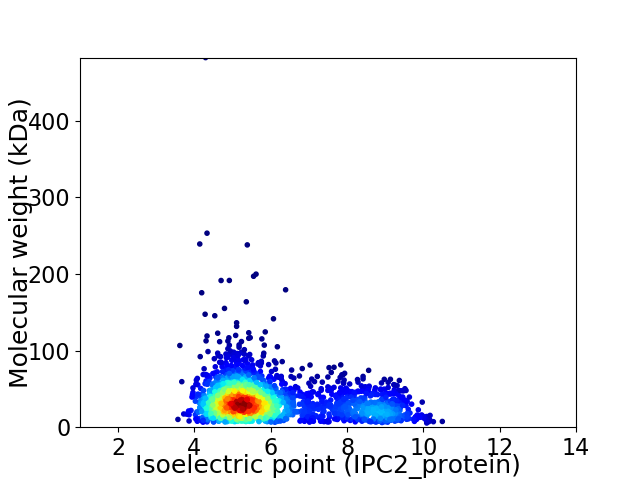
Average proteome isoelectric point is 6.03
Get precalculated fractions of proteins

Virtual 2D-PAGE plot for 2225 proteins (isoelectric point calculated using IPC2_protein)
Get csv file with sequences according to given criteria:
* You can choose from 21 different methods for calculating isoelectric point
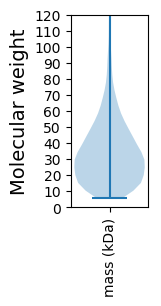
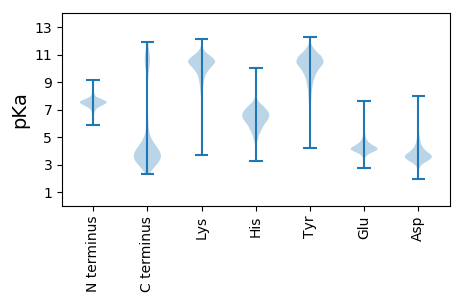
Summary statistics related to proteome-wise predictions


Protein with the lowest isoelectric point:
>tr|A0A0X8GZ37|A0A0X8GZ37_9FIRM Polyprenyl glycosylphosphotransferase OS=Erysipelothrix larvae OX=1514105 GN=AOC36_02510 PE=3 SV=1
MM1 pKa = 7.67LLLLLIITGCAQSNPSTDD19 pKa = 2.88ATGFLCEE26 pKa = 4.09KK27 pKa = 9.98QDD29 pKa = 3.67YY30 pKa = 10.51GLVEE34 pKa = 4.26VRR36 pKa = 11.84EE37 pKa = 4.9LILDD41 pKa = 3.47SDD43 pKa = 4.1GTIKK47 pKa = 10.86KK48 pKa = 10.1LISTSRR54 pKa = 11.84IEE56 pKa = 4.16FDD58 pKa = 3.24ASQSADD64 pKa = 3.4VTIEE68 pKa = 4.09DD69 pKa = 3.73YY70 pKa = 11.81QMFLAQLYY78 pKa = 8.9EE79 pKa = 4.37SLVSQDD85 pKa = 4.32DD86 pKa = 4.63GINYY90 pKa = 9.78SSQIIEE96 pKa = 4.51NIIEE100 pKa = 4.28VIMTFDD106 pKa = 3.46MVQISDD112 pKa = 3.93STLVWLGLPIEE123 pKa = 4.33NTQNRR128 pKa = 11.84IIVEE132 pKa = 3.8QYY134 pKa = 10.53IDD136 pKa = 3.57NLEE139 pKa = 4.37SNGYY143 pKa = 6.99QCKK146 pKa = 7.66TTTATLGG153 pKa = 3.4
MM1 pKa = 7.67LLLLLIITGCAQSNPSTDD19 pKa = 2.88ATGFLCEE26 pKa = 4.09KK27 pKa = 9.98QDD29 pKa = 3.67YY30 pKa = 10.51GLVEE34 pKa = 4.26VRR36 pKa = 11.84EE37 pKa = 4.9LILDD41 pKa = 3.47SDD43 pKa = 4.1GTIKK47 pKa = 10.86KK48 pKa = 10.1LISTSRR54 pKa = 11.84IEE56 pKa = 4.16FDD58 pKa = 3.24ASQSADD64 pKa = 3.4VTIEE68 pKa = 4.09DD69 pKa = 3.73YY70 pKa = 11.81QMFLAQLYY78 pKa = 8.9EE79 pKa = 4.37SLVSQDD85 pKa = 4.32DD86 pKa = 4.63GINYY90 pKa = 9.78SSQIIEE96 pKa = 4.51NIIEE100 pKa = 4.28VIMTFDD106 pKa = 3.46MVQISDD112 pKa = 3.93STLVWLGLPIEE123 pKa = 4.33NTQNRR128 pKa = 11.84IIVEE132 pKa = 3.8QYY134 pKa = 10.53IDD136 pKa = 3.57NLEE139 pKa = 4.37SNGYY143 pKa = 6.99QCKK146 pKa = 7.66TTTATLGG153 pKa = 3.4
Molecular weight: 17.07 kDa
Isoelectric point according different methods:
Protein with the highest isoelectric point:
>tr|A0A109UHS8|A0A109UHS8_9FIRM Uncharacterized protein OS=Erysipelothrix larvae OX=1514105 GN=AOC36_11715 PE=4 SV=1
MM1 pKa = 7.29NFAPIFGLIALSMMFFVIGSLRR23 pKa = 11.84NINVLFGLKK32 pKa = 10.25AILNQSVVVAIVATGAIFIYY52 pKa = 10.62SLGSFDD58 pKa = 3.66ISLGASVTVSALLGAITFNATNSILLMFLVCILVAVSIALFNSVLASIFNLPVFVTTIAMLSVLNAIVLLLISVNGTGSTVSISASSVQNLNTEE152 pKa = 3.98WFKK155 pKa = 10.98IATLMVFAGLCTFLFNFTRR174 pKa = 11.84LGRR177 pKa = 11.84MQKK180 pKa = 10.49FIGGNPICARR190 pKa = 11.84LTGISSKK197 pKa = 10.33KK198 pKa = 9.7ISIISFALSGLGVGIGAFLLIVYY221 pKa = 10.05APTLTRR227 pKa = 11.84NSASSVGMDD236 pKa = 3.32VIIAIVFGGMPISGGARR253 pKa = 11.84SKK255 pKa = 10.38IYY257 pKa = 10.37SAIVGSFSMTFLSQIMVMFNMNSGINQIVKK287 pKa = 10.48AIIFILVVYY296 pKa = 9.84LATSNQRR303 pKa = 11.84RR304 pKa = 11.84KK305 pKa = 9.85ILPRR309 pKa = 4.54
MM1 pKa = 7.29NFAPIFGLIALSMMFFVIGSLRR23 pKa = 11.84NINVLFGLKK32 pKa = 10.25AILNQSVVVAIVATGAIFIYY52 pKa = 10.62SLGSFDD58 pKa = 3.66ISLGASVTVSALLGAITFNATNSILLMFLVCILVAVSIALFNSVLASIFNLPVFVTTIAMLSVLNAIVLLLISVNGTGSTVSISASSVQNLNTEE152 pKa = 3.98WFKK155 pKa = 10.98IATLMVFAGLCTFLFNFTRR174 pKa = 11.84LGRR177 pKa = 11.84MQKK180 pKa = 10.49FIGGNPICARR190 pKa = 11.84LTGISSKK197 pKa = 10.33KK198 pKa = 9.7ISIISFALSGLGVGIGAFLLIVYY221 pKa = 10.05APTLTRR227 pKa = 11.84NSASSVGMDD236 pKa = 3.32VIIAIVFGGMPISGGARR253 pKa = 11.84SKK255 pKa = 10.38IYY257 pKa = 10.37SAIVGSFSMTFLSQIMVMFNMNSGINQIVKK287 pKa = 10.48AIIFILVVYY296 pKa = 9.84LATSNQRR303 pKa = 11.84RR304 pKa = 11.84KK305 pKa = 9.85ILPRR309 pKa = 4.54
Molecular weight: 32.73 kDa
Isoelectric point according different methods:
Peptides (in silico digests for buttom-up proteomics)
Below you can find in silico digests of the whole proteome with Trypsin, Chymotrypsin, Trypsin+LysC, LysN, ArgC proteases suitable for different mass spec machines.| Try ESI |
 |
|---|
| ChTry ESI |
 |
|---|
| ArgC ESI |
 |
|---|
| LysN ESI |
 |
|---|
| TryLysC ESI |
 |
|---|
| Try MALDI |
 |
|---|
| ChTry MALDI |
 |
|---|
| ArgC MALDI |
 |
|---|
| LysN MALDI |
 |
|---|
| TryLysC MALDI |
 |
|---|
| Try LTQ |
 |
|---|
| ChTry LTQ |
 |
|---|
| ArgC LTQ |
 |
|---|
| LysN LTQ |
 |
|---|
| TryLysC LTQ |
 |
|---|
| Try MSlow |
 |
|---|
| ChTry MSlow |
 |
|---|
| ArgC MSlow |
 |
|---|
| LysN MSlow |
 |
|---|
| TryLysC MSlow |
 |
|---|
| Try MShigh |
 |
|---|
| ChTry MShigh |
 |
|---|
| ArgC MShigh |
 |
|---|
| LysN MShigh |
 |
|---|
| TryLysC MShigh |
 |
|---|
General Statistics
Number of major isoforms |
Number of additional isoforms |
Number of all proteins |
Number of amino acids |
Min. Seq. Length |
Max. Seq. Length |
Avg. Seq. Length |
Avg. Mol. Weight |
|---|---|---|---|---|---|---|---|
0 |
709240 |
46 |
4515 |
318.8 |
35.88 |
Amino acid frequency
Ala |
Cys |
Asp |
Glu |
Phe |
Gly |
His |
Ile |
Lys |
Leu |
|---|---|---|---|---|---|---|---|---|---|
6.125 ± 0.045 | 0.908 ± 0.018 |
6.025 ± 0.043 | 6.435 ± 0.057 |
4.599 ± 0.037 | 6.298 ± 0.05 |
2.213 ± 0.026 | 8.259 ± 0.05 |
6.246 ± 0.047 | 9.572 ± 0.058 |
Met |
Asn |
Gln |
Pro |
Arg |
Ser |
Thr |
Val |
Trp |
Tyr |
|---|---|---|---|---|---|---|---|---|---|
2.75 ± 0.029 | 5.114 ± 0.043 |
3.159 ± 0.032 | 3.54 ± 0.03 |
3.913 ± 0.042 | 6.672 ± 0.046 |
5.938 ± 0.076 | 7.357 ± 0.05 |
0.794 ± 0.018 | 4.084 ± 0.037 |
Most of the basic statistics you can see at this page can be downloaded from this CSV file
Proteome-pI is available under Creative Commons Attribution-NoDerivs license, for more details see here
| Reference: Kozlowski LP. Proteome-pI 2.0: Proteome Isoelectric Point Database Update. Nucleic Acids Res. 2021, doi: 10.1093/nar/gkab944 | Contact: Lukasz P. Kozlowski |
