Rottboellia yellow mottle virus
Taxonomy: Viruses; Riboviria; Orthornavirae; Pisuviricota; Pisoniviricetes; Sobelivirales; Solemoviridae; Sobemovirus
Average proteome isoelectric point is 6.7
Get precalculated fractions of proteins

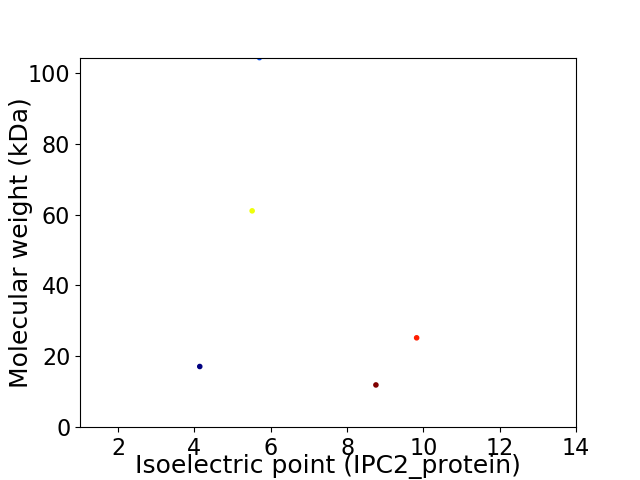
Virtual 2D-PAGE plot for 5 proteins (isoelectric point calculated using IPC2_protein)
Get csv file with sequences according to given criteria:
* You can choose from 21 different methods for calculating isoelectric point
Summary statistics related to proteome-wise predictions


Protein with the lowest isoelectric point:
>tr|A0A0E3ISH8|A0A0E3ISH8_9VIRU Putative Px OS=Rottboellia yellow mottle virus OX=1432563 GN=ORFx PE=4 SV=1
MM1 pKa = 7.11TRR3 pKa = 11.84LEE5 pKa = 4.37IKK7 pKa = 9.54VHH9 pKa = 6.3PSQTTASAFRR19 pKa = 11.84AYY21 pKa = 10.3YY22 pKa = 10.66GSGPLYY28 pKa = 9.35KK29 pKa = 9.69WAVHH33 pKa = 5.44SCEE36 pKa = 4.05IDD38 pKa = 3.52DD39 pKa = 4.56VEE41 pKa = 5.33IEE43 pKa = 3.86GDD45 pKa = 3.57YY46 pKa = 11.06DD47 pKa = 4.12YY48 pKa = 11.55DD49 pKa = 3.77SCSYY53 pKa = 10.87LYY55 pKa = 11.0VEE57 pKa = 5.52ISCEE61 pKa = 4.26SCGKK65 pKa = 8.0TLEE68 pKa = 4.52DD69 pKa = 4.2FSVEE73 pKa = 3.55VDD75 pKa = 3.39RR76 pKa = 11.84FRR78 pKa = 11.84SLSPSRR84 pKa = 11.84IEE86 pKa = 4.14ATCEE90 pKa = 3.75QYY92 pKa = 10.92NCKK95 pKa = 10.26CGEE98 pKa = 4.15EE99 pKa = 4.21EE100 pKa = 4.33SSEE103 pKa = 4.19DD104 pKa = 3.67EE105 pKa = 3.91EE106 pKa = 5.47AEE108 pKa = 4.33FYY110 pKa = 11.17SEE112 pKa = 4.35FLSKK116 pKa = 10.32FDD118 pKa = 3.88RR119 pKa = 11.84LSAGEE124 pKa = 3.89VSGAFTAQVDD134 pKa = 3.84SDD136 pKa = 4.17SEE138 pKa = 4.32EE139 pKa = 4.16EE140 pKa = 3.73IVYY143 pKa = 10.11QGRR146 pKa = 11.84GGHH149 pKa = 7.07DD150 pKa = 3.11SDD152 pKa = 4.52
MM1 pKa = 7.11TRR3 pKa = 11.84LEE5 pKa = 4.37IKK7 pKa = 9.54VHH9 pKa = 6.3PSQTTASAFRR19 pKa = 11.84AYY21 pKa = 10.3YY22 pKa = 10.66GSGPLYY28 pKa = 9.35KK29 pKa = 9.69WAVHH33 pKa = 5.44SCEE36 pKa = 4.05IDD38 pKa = 3.52DD39 pKa = 4.56VEE41 pKa = 5.33IEE43 pKa = 3.86GDD45 pKa = 3.57YY46 pKa = 11.06DD47 pKa = 4.12YY48 pKa = 11.55DD49 pKa = 3.77SCSYY53 pKa = 10.87LYY55 pKa = 11.0VEE57 pKa = 5.52ISCEE61 pKa = 4.26SCGKK65 pKa = 8.0TLEE68 pKa = 4.52DD69 pKa = 4.2FSVEE73 pKa = 3.55VDD75 pKa = 3.39RR76 pKa = 11.84FRR78 pKa = 11.84SLSPSRR84 pKa = 11.84IEE86 pKa = 4.14ATCEE90 pKa = 3.75QYY92 pKa = 10.92NCKK95 pKa = 10.26CGEE98 pKa = 4.15EE99 pKa = 4.21EE100 pKa = 4.33SSEE103 pKa = 4.19DD104 pKa = 3.67EE105 pKa = 3.91EE106 pKa = 5.47AEE108 pKa = 4.33FYY110 pKa = 11.17SEE112 pKa = 4.35FLSKK116 pKa = 10.32FDD118 pKa = 3.88RR119 pKa = 11.84LSAGEE124 pKa = 3.89VSGAFTAQVDD134 pKa = 3.84SDD136 pKa = 4.17SEE138 pKa = 4.32EE139 pKa = 4.16EE140 pKa = 3.73IVYY143 pKa = 10.11QGRR146 pKa = 11.84GGHH149 pKa = 7.07DD150 pKa = 3.11SDD152 pKa = 4.52
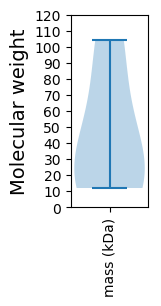
Molecular weight: 17.13 kDa
Isoelectric point according different methods:
Protein with the highest isoelectric point:
>tr|A0A0E3D8Q7|A0A0E3D8Q7_9VIRU Putative RNA silencing suppressor OS=Rottboellia yellow mottle virus OX=1432563 GN=P1 PE=4 SV=1
MM1 pKa = 7.14TKK3 pKa = 10.02RR4 pKa = 11.84RR5 pKa = 11.84TRR7 pKa = 11.84ARR9 pKa = 11.84RR10 pKa = 11.84KK11 pKa = 8.39ATKK14 pKa = 9.44TSNRR18 pKa = 11.84TPNEE22 pKa = 3.64RR23 pKa = 11.84RR24 pKa = 11.84TMEE27 pKa = 4.01SGTRR31 pKa = 11.84SVSRR35 pKa = 11.84VSAPATAGALISYY48 pKa = 9.74RR49 pKa = 11.84GGISWSPAAGTTIVTNSGSLAVVQSSATAGAEE81 pKa = 3.94VTGTVNFNVRR91 pKa = 11.84NATEE95 pKa = 4.58LPWLSTFGPAFSKK108 pKa = 10.97YY109 pKa = 8.2RR110 pKa = 11.84VKK112 pKa = 10.65SASFTWEE119 pKa = 3.94PVVGTSTNGEE129 pKa = 3.52ICMALLYY136 pKa = 10.72DD137 pKa = 3.92QADD140 pKa = 3.82PAASSLSIRR149 pKa = 11.84RR150 pKa = 11.84LMQTSRR156 pKa = 11.84SEE158 pKa = 3.86WGPIWARR165 pKa = 11.84SKK167 pKa = 10.88QPVVVDD173 pKa = 3.59ISRR176 pKa = 11.84MSLKK180 pKa = 9.88WYY182 pKa = 10.44LSGATAGVAAGNFQTPFALAYY203 pKa = 9.33AAQSSTTSTNLGRR216 pKa = 11.84IMVQYY221 pKa = 9.58VVEE224 pKa = 5.37FIEE227 pKa = 4.75PVDD230 pKa = 3.59PTVNSS235 pKa = 3.68
MM1 pKa = 7.14TKK3 pKa = 10.02RR4 pKa = 11.84RR5 pKa = 11.84TRR7 pKa = 11.84ARR9 pKa = 11.84RR10 pKa = 11.84KK11 pKa = 8.39ATKK14 pKa = 9.44TSNRR18 pKa = 11.84TPNEE22 pKa = 3.64RR23 pKa = 11.84RR24 pKa = 11.84TMEE27 pKa = 4.01SGTRR31 pKa = 11.84SVSRR35 pKa = 11.84VSAPATAGALISYY48 pKa = 9.74RR49 pKa = 11.84GGISWSPAAGTTIVTNSGSLAVVQSSATAGAEE81 pKa = 3.94VTGTVNFNVRR91 pKa = 11.84NATEE95 pKa = 4.58LPWLSTFGPAFSKK108 pKa = 10.97YY109 pKa = 8.2RR110 pKa = 11.84VKK112 pKa = 10.65SASFTWEE119 pKa = 3.94PVVGTSTNGEE129 pKa = 3.52ICMALLYY136 pKa = 10.72DD137 pKa = 3.92QADD140 pKa = 3.82PAASSLSIRR149 pKa = 11.84RR150 pKa = 11.84LMQTSRR156 pKa = 11.84SEE158 pKa = 3.86WGPIWARR165 pKa = 11.84SKK167 pKa = 10.88QPVVVDD173 pKa = 3.59ISRR176 pKa = 11.84MSLKK180 pKa = 9.88WYY182 pKa = 10.44LSGATAGVAAGNFQTPFALAYY203 pKa = 9.33AAQSSTTSTNLGRR216 pKa = 11.84IMVQYY221 pKa = 9.58VVEE224 pKa = 5.37FIEE227 pKa = 4.75PVDD230 pKa = 3.59PTVNSS235 pKa = 3.68
Molecular weight: 25.23 kDa
Isoelectric point according different methods:
Peptides (in silico digests for buttom-up proteomics)
Below you can find in silico digests of the whole proteome with Trypsin, Chymotrypsin, Trypsin+LysC, LysN, ArgC proteases suitable for different mass spec machines.| Try ESI |
 |
|---|
| ChTry ESI |
 |
|---|
| ArgC ESI |
 |
|---|
| LysN ESI |
 |
|---|
| TryLysC ESI |
 |
|---|
| Try MALDI |
 |
|---|
| ChTry MALDI |
 |
|---|
| ArgC MALDI |
 |
|---|
| LysN MALDI |
 |
|---|
| TryLysC MALDI |
 |
|---|
| Try LTQ |
 |
|---|
| ChTry LTQ |
 |
|---|
| ArgC LTQ |
 |
|---|
| LysN LTQ |
 |
|---|
| TryLysC LTQ |
 |
|---|
| Try MSlow |
 |
|---|
| ChTry MSlow |
 |
|---|
| ArgC MSlow |
 |
|---|
| LysN MSlow |
 |
|---|
| TryLysC MSlow |
 |
|---|
| Try MShigh |
 |
|---|
| ChTry MShigh |
 |
|---|
| ArgC MShigh |
 |
|---|
| LysN MShigh |
 |
|---|
| TryLysC MShigh |
 |
|---|
General Statistics
Number of major isoforms |
Number of additional isoforms |
Number of all proteins |
Number of amino acids |
Min. Seq. Length |
Max. Seq. Length |
Avg. Seq. Length |
Avg. Mol. Weight |
|---|---|---|---|---|---|---|---|
0 |
1981 |
106 |
934 |
396.2 |
43.93 |
Amino acid frequency
Ala |
Cys |
Asp |
Glu |
Phe |
Gly |
His |
Ile |
Lys |
Leu |
|---|---|---|---|---|---|---|---|---|---|
8.228 ± 0.982 | 1.868 ± 0.408 |
4.846 ± 0.652 | 8.43 ± 0.967 |
3.079 ± 0.379 | 7.521 ± 0.381 |
1.767 ± 0.31 | 3.584 ± 0.297 |
4.745 ± 0.632 | 8.127 ± 1.051 |
Met |
Asn |
Gln |
Pro |
Arg |
Ser |
Thr |
Val |
Trp |
Tyr |
|---|---|---|---|---|---|---|---|---|---|
1.868 ± 0.217 | 2.272 ± 0.344 |
4.796 ± 0.448 | 3.332 ± 0.351 |
7.118 ± 0.914 | 11.005 ± 0.866 |
4.695 ± 1.284 | 7.32 ± 0.405 |
2.322 ± 0.312 | 3.079 ± 0.546 |
Most of the basic statistics you can see at this page can be downloaded from this CSV file
Proteome-pI is available under Creative Commons Attribution-NoDerivs license, for more details see here
| Reference: Kozlowski LP. Proteome-pI 2.0: Proteome Isoelectric Point Database Update. Nucleic Acids Res. 2021, doi: 10.1093/nar/gkab944 | Contact: Lukasz P. Kozlowski |
