Puccinia graminis f. sp. tritici (strain CRL 75-36-700-3 / race SCCL) (Black stem rust fungus)
Taxonomy: cellular organisms; Eukaryota; Opisthokonta; Fungi; Dikarya; Basidiomycota; Pucciniomycotina; Pucciniomycetes; Pucciniales; Pucciniaceae; Puccinia; Puccinia graminis; Puccinia graminis f. sp. tritici
Average proteome isoelectric point is 7.0
Get precalculated fractions of proteins

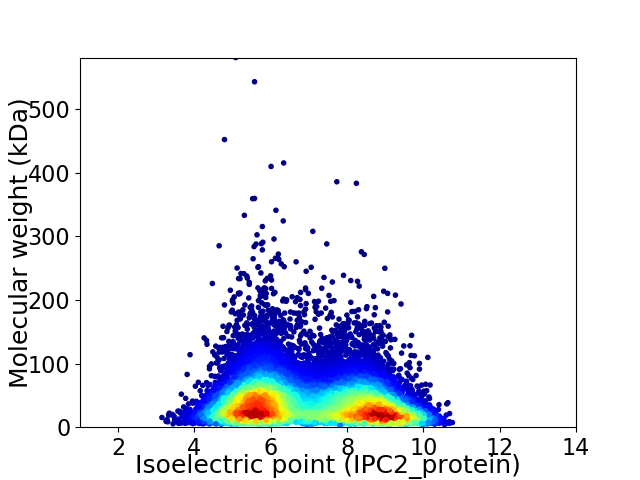
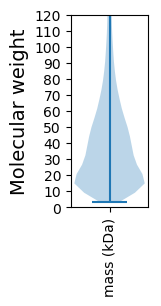
Virtual 2D-PAGE plot for 15808 proteins (isoelectric point calculated using IPC2_protein)
Get csv file with sequences according to given criteria:
* You can choose from 21 different methods for calculating isoelectric point
Summary statistics related to proteome-wise predictions


Protein with the lowest isoelectric point:
>tr|E3LAP3|E3LAP3_PUCGT Uncharacterized protein OS=Puccinia graminis f. sp. tritici (strain CRL 75-36-700-3 / race SCCL) OX=418459 GN=PGTG_19617 PE=4 SV=2
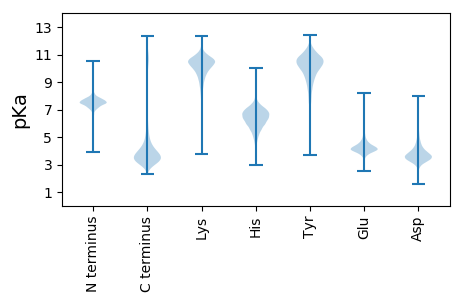
MM1 pKa = 7.58PRR3 pKa = 11.84FSPNEE8 pKa = 4.01DD9 pKa = 3.25SSSDD13 pKa = 3.59DD14 pKa = 4.35FYY16 pKa = 11.75SSSNASPKK24 pKa = 10.46SPSISSKK31 pKa = 10.0ATGDD35 pKa = 3.4SDD37 pKa = 4.63EE38 pKa = 5.05DD39 pKa = 4.27HH40 pKa = 7.3SDD42 pKa = 4.43DD43 pKa = 5.27PNTSDD48 pKa = 5.34DD49 pKa = 4.32QPDD52 pKa = 3.76TNIFNCNLYY61 pKa = 10.88GSTTGSSSCSNSNDD75 pKa = 3.81SNEE78 pKa = 4.16HH79 pKa = 6.62RR80 pKa = 11.84SDD82 pKa = 5.18ADD84 pKa = 4.8DD85 pKa = 4.05KK86 pKa = 11.94DD87 pKa = 4.23EE88 pKa = 4.76NNSCSEE94 pKa = 3.95EE95 pKa = 3.92DD96 pKa = 3.45SYY98 pKa = 11.82LISSSYY104 pKa = 9.56NHH106 pKa = 6.77CKK108 pKa = 9.83PSNSSEE114 pKa = 3.92EE115 pKa = 4.38SEE117 pKa = 4.8DD118 pKa = 4.05GSDD121 pKa = 3.56ATDD124 pKa = 3.12SDD126 pKa = 4.58KK127 pKa = 11.75EE128 pKa = 4.21HH129 pKa = 6.88VDD131 pKa = 3.66YY132 pKa = 11.29SASNN136 pKa = 3.28
MM1 pKa = 7.58PRR3 pKa = 11.84FSPNEE8 pKa = 4.01DD9 pKa = 3.25SSSDD13 pKa = 3.59DD14 pKa = 4.35FYY16 pKa = 11.75SSSNASPKK24 pKa = 10.46SPSISSKK31 pKa = 10.0ATGDD35 pKa = 3.4SDD37 pKa = 4.63EE38 pKa = 5.05DD39 pKa = 4.27HH40 pKa = 7.3SDD42 pKa = 4.43DD43 pKa = 5.27PNTSDD48 pKa = 5.34DD49 pKa = 4.32QPDD52 pKa = 3.76TNIFNCNLYY61 pKa = 10.88GSTTGSSSCSNSNDD75 pKa = 3.81SNEE78 pKa = 4.16HH79 pKa = 6.62RR80 pKa = 11.84SDD82 pKa = 5.18ADD84 pKa = 4.8DD85 pKa = 4.05KK86 pKa = 11.94DD87 pKa = 4.23EE88 pKa = 4.76NNSCSEE94 pKa = 3.95EE95 pKa = 3.92DD96 pKa = 3.45SYY98 pKa = 11.82LISSSYY104 pKa = 9.56NHH106 pKa = 6.77CKK108 pKa = 9.83PSNSSEE114 pKa = 3.92EE115 pKa = 4.38SEE117 pKa = 4.8DD118 pKa = 4.05GSDD121 pKa = 3.56ATDD124 pKa = 3.12SDD126 pKa = 4.58KK127 pKa = 11.75EE128 pKa = 4.21HH129 pKa = 6.88VDD131 pKa = 3.66YY132 pKa = 11.29SASNN136 pKa = 3.28
Molecular weight: 14.63 kDa
Isoelectric point according different methods:
Protein with the highest isoelectric point:
>tr|H6QSI2|H6QSI2_PUCGT AGC protein kinase OS=Puccinia graminis f. sp. tritici (strain CRL 75-36-700-3 / race SCCL) OX=418459 GN=PGTG_21795 PE=4 SV=1
MM1 pKa = 8.38VMGTGRR7 pKa = 11.84WRR9 pKa = 11.84KK10 pKa = 9.59VMPQQDD16 pKa = 3.6RR17 pKa = 11.84QSISLQLTAIRR28 pKa = 11.84TRR30 pKa = 11.84MKK32 pKa = 9.67VTGRR36 pKa = 11.84LPDD39 pKa = 3.64PNMRR43 pKa = 11.84MRR45 pKa = 11.84SRR47 pKa = 11.84SRR49 pKa = 11.84VRR51 pKa = 11.84RR52 pKa = 11.84PISIRR57 pKa = 11.84AGFSNN62 pKa = 3.64
MM1 pKa = 8.38VMGTGRR7 pKa = 11.84WRR9 pKa = 11.84KK10 pKa = 9.59VMPQQDD16 pKa = 3.6RR17 pKa = 11.84QSISLQLTAIRR28 pKa = 11.84TRR30 pKa = 11.84MKK32 pKa = 9.67VTGRR36 pKa = 11.84LPDD39 pKa = 3.64PNMRR43 pKa = 11.84MRR45 pKa = 11.84SRR47 pKa = 11.84SRR49 pKa = 11.84VRR51 pKa = 11.84RR52 pKa = 11.84PISIRR57 pKa = 11.84AGFSNN62 pKa = 3.64
Molecular weight: 7.27 kDa
Isoelectric point according different methods:
Peptides (in silico digests for buttom-up proteomics)
Below you can find in silico digests of the whole proteome with Trypsin, Chymotrypsin, Trypsin+LysC, LysN, ArgC proteases suitable for different mass spec machines.| Try ESI |
 |
|---|
| ChTry ESI |
 |
|---|
| ArgC ESI |
 |
|---|
| LysN ESI |
 |
|---|
| TryLysC ESI |
 |
|---|
| Try MALDI |
 |
|---|
| ChTry MALDI |
 |
|---|
| ArgC MALDI |
 |
|---|
| LysN MALDI |
 |
|---|
| TryLysC MALDI |
 |
|---|
| Try LTQ |
 |
|---|
| ChTry LTQ |
 |
|---|
| ArgC LTQ |
 |
|---|
| LysN LTQ |
 |
|---|
| TryLysC LTQ |
 |
|---|
| Try MSlow |
 |
|---|
| ChTry MSlow |
 |
|---|
| ArgC MSlow |
 |
|---|
| LysN MSlow |
 |
|---|
| TryLysC MSlow |
 |
|---|
| Try MShigh |
 |
|---|
| ChTry MShigh |
 |
|---|
| ArgC MShigh |
 |
|---|
| LysN MShigh |
 |
|---|
| TryLysC MShigh |
 |
|---|
General Statistics
Number of major isoforms |
Number of additional isoforms |
Number of all proteins |
Number of amino acids |
Min. Seq. Length |
Max. Seq. Length |
Avg. Seq. Length |
Avg. Mol. Weight |
|---|---|---|---|---|---|---|---|
6249486 |
29 |
5214 |
395.3 |
43.96 |
Amino acid frequency
Ala |
Cys |
Asp |
Glu |
Phe |
Gly |
His |
Ile |
Lys |
Leu |
|---|---|---|---|---|---|---|---|---|---|
7.125 ± 0.018 | 1.326 ± 0.008 |
5.413 ± 0.015 | 5.885 ± 0.02 |
3.603 ± 0.012 | 5.8 ± 0.019 |
2.865 ± 0.011 | 5.157 ± 0.012 |
5.539 ± 0.018 | 9.348 ± 0.02 |
Met |
Asn |
Gln |
Pro |
Arg |
Ser |
Thr |
Val |
Trp |
Tyr |
|---|---|---|---|---|---|---|---|---|---|
1.95 ± 0.008 | 4.494 ± 0.012 |
6.677 ± 0.021 | 4.722 ± 0.015 |
5.689 ± 0.017 | 9.69 ± 0.026 |
5.976 ± 0.014 | 5.141 ± 0.013 |
1.23 ± 0.006 | 2.37 ± 0.009 |
Most of the basic statistics you can see at this page can be downloaded from this CSV file
Proteome-pI is available under Creative Commons Attribution-NoDerivs license, for more details see here
| Reference: Kozlowski LP. Proteome-pI 2.0: Proteome Isoelectric Point Database Update. Nucleic Acids Res. 2021, doi: 10.1093/nar/gkab944 | Contact: Lukasz P. Kozlowski |
