Cow vetch latent virus
Taxonomy: Viruses; Monodnaviria; Shotokuvirae; Cressdnaviricota; Arfiviricetes; Mulpavirales; Nanoviridae; Nanovirus
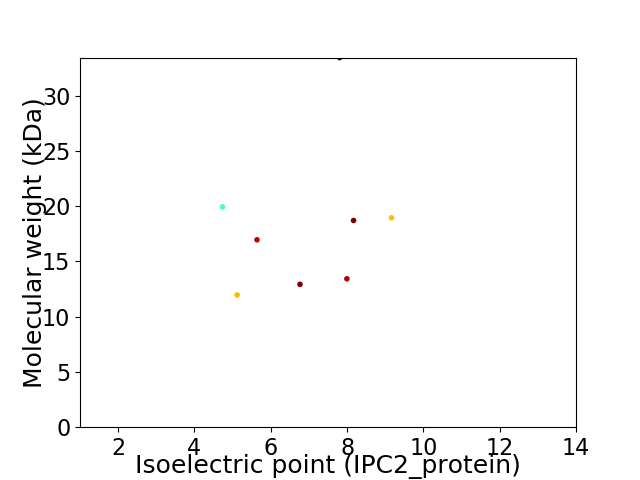
Average proteome isoelectric point is 6.83
Get precalculated fractions of proteins

Virtual 2D-PAGE plot for 8 proteins (isoelectric point calculated using IPC2_protein)
Get csv file with sequences according to given criteria:
* You can choose from 21 different methods for calculating isoelectric point
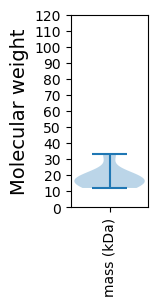
Summary statistics related to proteome-wise predictions


Protein with the lowest isoelectric point:
>tr|A0A2H4T2E8|A0A2H4T2E8_9VIRU Cell cycle link protein OS=Cow vetch latent virus OX=2056780 GN=clink PE=4 SV=1
MM1 pKa = 6.46VLKK4 pKa = 10.54YY5 pKa = 10.18FSLLPSEE12 pKa = 4.55LKK14 pKa = 10.02EE15 pKa = 4.23KK16 pKa = 10.32IVRR19 pKa = 11.84EE20 pKa = 3.91HH21 pKa = 6.38LKK23 pKa = 10.53EE24 pKa = 3.73EE25 pKa = 4.22RR26 pKa = 11.84KK27 pKa = 9.81RR28 pKa = 11.84EE29 pKa = 3.85FLEE32 pKa = 4.01NSVLAACRR40 pKa = 11.84RR41 pKa = 11.84YY42 pKa = 10.41EE43 pKa = 4.55DD44 pKa = 5.45LLLKK48 pKa = 10.61DD49 pKa = 5.48DD50 pKa = 4.09ITDD53 pKa = 3.51EE54 pKa = 4.27EE55 pKa = 4.78LLHH58 pKa = 6.52LSKK61 pKa = 10.77FLDD64 pKa = 3.53SLVQYY69 pKa = 8.42VTDD72 pKa = 4.39YY73 pKa = 10.89IGSRR77 pKa = 11.84CLIRR81 pKa = 11.84WKK83 pKa = 10.49KK84 pKa = 10.41DD85 pKa = 2.85VSPRR89 pKa = 11.84VKK91 pKa = 10.16YY92 pKa = 10.76SVMEE96 pKa = 3.98EE97 pKa = 3.77QHH99 pKa = 5.23IQLYY103 pKa = 9.12GFRR106 pKa = 11.84DD107 pKa = 3.79MEE109 pKa = 4.49DD110 pKa = 3.73LSCEE114 pKa = 3.99EE115 pKa = 4.22LLLPEE120 pKa = 4.18VEE122 pKa = 4.17EE123 pKa = 5.38DD124 pKa = 2.86ITYY127 pKa = 10.26EE128 pKa = 3.95DD129 pKa = 4.43GMIVNCGQLDD139 pKa = 3.68ALFRR143 pKa = 11.84DD144 pKa = 3.94LGVTVVYY151 pKa = 8.92ITIGNGLILLPMCKK165 pKa = 9.84EE166 pKa = 3.9IVITT170 pKa = 4.5
MM1 pKa = 6.46VLKK4 pKa = 10.54YY5 pKa = 10.18FSLLPSEE12 pKa = 4.55LKK14 pKa = 10.02EE15 pKa = 4.23KK16 pKa = 10.32IVRR19 pKa = 11.84EE20 pKa = 3.91HH21 pKa = 6.38LKK23 pKa = 10.53EE24 pKa = 3.73EE25 pKa = 4.22RR26 pKa = 11.84KK27 pKa = 9.81RR28 pKa = 11.84EE29 pKa = 3.85FLEE32 pKa = 4.01NSVLAACRR40 pKa = 11.84RR41 pKa = 11.84YY42 pKa = 10.41EE43 pKa = 4.55DD44 pKa = 5.45LLLKK48 pKa = 10.61DD49 pKa = 5.48DD50 pKa = 4.09ITDD53 pKa = 3.51EE54 pKa = 4.27EE55 pKa = 4.78LLHH58 pKa = 6.52LSKK61 pKa = 10.77FLDD64 pKa = 3.53SLVQYY69 pKa = 8.42VTDD72 pKa = 4.39YY73 pKa = 10.89IGSRR77 pKa = 11.84CLIRR81 pKa = 11.84WKK83 pKa = 10.49KK84 pKa = 10.41DD85 pKa = 2.85VSPRR89 pKa = 11.84VKK91 pKa = 10.16YY92 pKa = 10.76SVMEE96 pKa = 3.98EE97 pKa = 3.77QHH99 pKa = 5.23IQLYY103 pKa = 9.12GFRR106 pKa = 11.84DD107 pKa = 3.79MEE109 pKa = 4.49DD110 pKa = 3.73LSCEE114 pKa = 3.99EE115 pKa = 4.22LLLPEE120 pKa = 4.18VEE122 pKa = 4.17EE123 pKa = 5.38DD124 pKa = 2.86ITYY127 pKa = 10.26EE128 pKa = 3.95DD129 pKa = 4.43GMIVNCGQLDD139 pKa = 3.68ALFRR143 pKa = 11.84DD144 pKa = 3.94LGVTVVYY151 pKa = 8.92ITIGNGLILLPMCKK165 pKa = 9.84EE166 pKa = 3.9IVITT170 pKa = 4.5
Molecular weight: 19.93 kDa
Isoelectric point according different methods:
Protein with the highest isoelectric point:
>tr|A0A2H4T2E3|A0A2H4T2E3_9VIRU U4 protein OS=Cow vetch latent virus OX=2056780 GN=U4 PE=4 SV=1
MM1 pKa = 6.96VSNWSSSGRR10 pKa = 11.84KK11 pKa = 6.9WRR13 pKa = 11.84HH14 pKa = 4.79SGRR17 pKa = 11.84KK18 pKa = 9.11GGGRR22 pKa = 11.84PFKK25 pKa = 10.36PIVPTTRR32 pKa = 11.84LVVHH36 pKa = 5.97STALLNKK43 pKa = 9.63DD44 pKa = 3.92DD45 pKa = 4.44VVGCEE50 pKa = 4.49IRR52 pKa = 11.84PKK54 pKa = 10.58DD55 pKa = 3.1ISRR58 pKa = 11.84YY59 pKa = 8.95KK60 pKa = 8.73MRR62 pKa = 11.84KK63 pKa = 9.02VMLTCTVRR71 pKa = 11.84MPPGEE76 pKa = 4.21LLNYY80 pKa = 10.26LVVKK84 pKa = 10.6CSSPLVNWGAAFSSPALLVKK104 pKa = 10.28EE105 pKa = 5.02DD106 pKa = 4.18CQDD109 pKa = 3.48MITILGKK116 pKa = 10.87GKK118 pKa = 10.06IEE120 pKa = 4.13SSGVAGSDD128 pKa = 3.44CTKK131 pKa = 10.46SFSRR135 pKa = 11.84FVKK138 pKa = 10.28LGSGVTQTQHH148 pKa = 7.01LYY150 pKa = 10.12VILYY154 pKa = 8.22TSVSMKK160 pKa = 10.43SVLEE164 pKa = 3.56HH165 pKa = 6.12RR166 pKa = 11.84MYY168 pKa = 11.42VEE170 pKa = 4.06VV171 pKa = 4.09
MM1 pKa = 6.96VSNWSSSGRR10 pKa = 11.84KK11 pKa = 6.9WRR13 pKa = 11.84HH14 pKa = 4.79SGRR17 pKa = 11.84KK18 pKa = 9.11GGGRR22 pKa = 11.84PFKK25 pKa = 10.36PIVPTTRR32 pKa = 11.84LVVHH36 pKa = 5.97STALLNKK43 pKa = 9.63DD44 pKa = 3.92DD45 pKa = 4.44VVGCEE50 pKa = 4.49IRR52 pKa = 11.84PKK54 pKa = 10.58DD55 pKa = 3.1ISRR58 pKa = 11.84YY59 pKa = 8.95KK60 pKa = 8.73MRR62 pKa = 11.84KK63 pKa = 9.02VMLTCTVRR71 pKa = 11.84MPPGEE76 pKa = 4.21LLNYY80 pKa = 10.26LVVKK84 pKa = 10.6CSSPLVNWGAAFSSPALLVKK104 pKa = 10.28EE105 pKa = 5.02DD106 pKa = 4.18CQDD109 pKa = 3.48MITILGKK116 pKa = 10.87GKK118 pKa = 10.06IEE120 pKa = 4.13SSGVAGSDD128 pKa = 3.44CTKK131 pKa = 10.46SFSRR135 pKa = 11.84FVKK138 pKa = 10.28LGSGVTQTQHH148 pKa = 7.01LYY150 pKa = 10.12VILYY154 pKa = 8.22TSVSMKK160 pKa = 10.43SVLEE164 pKa = 3.56HH165 pKa = 6.12RR166 pKa = 11.84MYY168 pKa = 11.42VEE170 pKa = 4.06VV171 pKa = 4.09
Molecular weight: 18.94 kDa
Isoelectric point according different methods:
Peptides (in silico digests for buttom-up proteomics)
Below you can find in silico digests of the whole proteome with Trypsin, Chymotrypsin, Trypsin+LysC, LysN, ArgC proteases suitable for different mass spec machines.| Try ESI |
 |
|---|
| ChTry ESI |
 |
|---|
| ArgC ESI |
 |
|---|
| LysN ESI |
 |
|---|
| TryLysC ESI |
 |
|---|
| Try MALDI |
 |
|---|
| ChTry MALDI |
 |
|---|
| ArgC MALDI |
 |
|---|
| LysN MALDI |
 |
|---|
| TryLysC MALDI |
 |
|---|
| Try LTQ |
 |
|---|
| ChTry LTQ |
 |
|---|
| ArgC LTQ |
 |
|---|
| LysN LTQ |
 |
|---|
| TryLysC LTQ |
 |
|---|
| Try MSlow |
 |
|---|
| ChTry MSlow |
 |
|---|
| ArgC MSlow |
 |
|---|
| LysN MSlow |
 |
|---|
| TryLysC MSlow |
 |
|---|
| Try MShigh |
 |
|---|
| ChTry MShigh |
 |
|---|
| ArgC MShigh |
 |
|---|
| LysN MShigh |
 |
|---|
| TryLysC MShigh |
 |
|---|
General Statistics
Number of major isoforms |
Number of additional isoforms |
Number of all proteins |
Number of amino acids |
Min. Seq. Length |
Max. Seq. Length |
Avg. Seq. Length |
Avg. Mol. Weight |
|---|---|---|---|---|---|---|---|
0 |
1269 |
104 |
286 |
158.6 |
18.28 |
Amino acid frequency
Ala |
Cys |
Asp |
Glu |
Phe |
Gly |
His |
Ile |
Lys |
Leu |
|---|---|---|---|---|---|---|---|---|---|
3.546 ± 0.561 | 2.837 ± 0.484 |
5.516 ± 0.498 | 6.619 ± 1.036 |
4.098 ± 0.471 | 6.147 ± 0.728 |
1.655 ± 0.208 | 5.91 ± 0.696 |
6.225 ± 0.493 | 10.402 ± 1.292 |
Met |
Asn |
Gln |
Pro |
Arg |
Ser |
Thr |
Val |
Trp |
Tyr |
|---|---|---|---|---|---|---|---|---|---|
3.861 ± 0.249 | 3.783 ± 0.587 |
3.388 ± 0.589 | 3.783 ± 0.483 |
6.698 ± 0.71 | 7.092 ± 0.95 |
4.019 ± 0.478 | 8.668 ± 0.988 |
1.497 ± 0.24 | 4.255 ± 0.372 |
Most of the basic statistics you can see at this page can be downloaded from this CSV file
Proteome-pI is available under Creative Commons Attribution-NoDerivs license, for more details see here
| Reference: Kozlowski LP. Proteome-pI 2.0: Proteome Isoelectric Point Database Update. Nucleic Acids Res. 2021, doi: 10.1093/nar/gkab944 | Contact: Lukasz P. Kozlowski |
