Erwinia sp. OLSSP12
Taxonomy: cellular organisms; Bacteria; Proteobacteria; Gammaproteobacteria; Enterobacterales; Erwiniaceae; Erwinia; unclassified Erwinia
Average proteome isoelectric point is 6.85
Get precalculated fractions of proteins
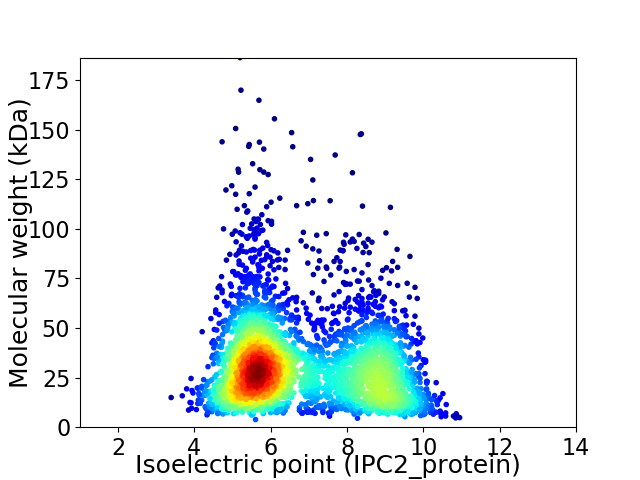
Virtual 2D-PAGE plot for 3383 proteins (isoelectric point calculated using IPC2_protein)
Get csv file with sequences according to given criteria:
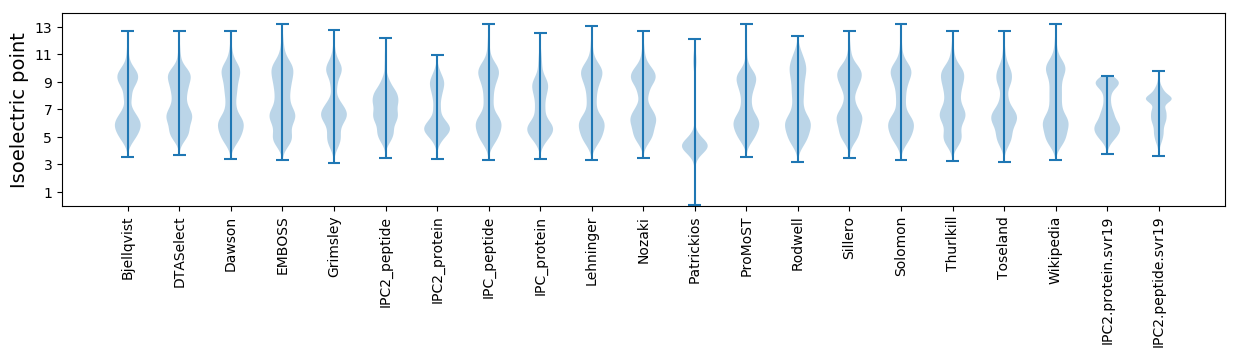
* You can choose from 21 different methods for calculating isoelectric point
Summary statistics related to proteome-wise predictions
Protein with the lowest isoelectric point:
>tr|A0A2G8EGV9|A0A2G8EGV9_9GAMM OmpR/PhoB-type domain-containing protein OS=Erwinia sp. OLSSP12 OX=1912096 GN=BK416_05855 PE=4 SV=1
MM1 pKa = 7.98SYY3 pKa = 11.22EE4 pKa = 4.04EE5 pKa = 4.36LLEE8 pKa = 4.09EE9 pKa = 4.17QRR11 pKa = 11.84EE12 pKa = 4.18EE13 pKa = 3.67TRR15 pKa = 11.84LIIDD19 pKa = 3.94EE20 pKa = 4.4LLEE23 pKa = 5.24DD24 pKa = 5.0GSDD27 pKa = 3.46PDD29 pKa = 3.46ALYY32 pKa = 9.93TIEE35 pKa = 4.77HH36 pKa = 6.75HH37 pKa = 6.84LSCANFDD44 pKa = 3.97ALEE47 pKa = 4.28KK48 pKa = 10.54VAVEE52 pKa = 4.15AFRR55 pKa = 11.84LGYY58 pKa = 10.25EE59 pKa = 4.01VTDD62 pKa = 3.98PEE64 pKa = 4.3EE65 pKa = 5.63LEE67 pKa = 5.16LEE69 pKa = 4.66DD70 pKa = 4.45GSKK73 pKa = 11.04VMCCDD78 pKa = 4.05IISEE82 pKa = 4.3LALNAALLDD91 pKa = 3.97EE92 pKa = 4.52QVEE95 pKa = 4.29QLVKK99 pKa = 10.66LAGKK103 pKa = 10.19FNVDD107 pKa = 2.85YY108 pKa = 10.7DD109 pKa = 3.37GWGTYY114 pKa = 10.12FEE116 pKa = 5.56DD117 pKa = 4.97PNAEE121 pKa = 4.4DD122 pKa = 4.13PQSDD126 pKa = 4.1DD127 pKa = 5.25DD128 pKa = 5.82YY129 pKa = 11.92VDD131 pKa = 4.04EE132 pKa = 6.24DD133 pKa = 4.64DD134 pKa = 5.86DD135 pKa = 4.65GVRR138 pKa = 11.84HH139 pKa = 6.05
MM1 pKa = 7.98SYY3 pKa = 11.22EE4 pKa = 4.04EE5 pKa = 4.36LLEE8 pKa = 4.09EE9 pKa = 4.17QRR11 pKa = 11.84EE12 pKa = 4.18EE13 pKa = 3.67TRR15 pKa = 11.84LIIDD19 pKa = 3.94EE20 pKa = 4.4LLEE23 pKa = 5.24DD24 pKa = 5.0GSDD27 pKa = 3.46PDD29 pKa = 3.46ALYY32 pKa = 9.93TIEE35 pKa = 4.77HH36 pKa = 6.75HH37 pKa = 6.84LSCANFDD44 pKa = 3.97ALEE47 pKa = 4.28KK48 pKa = 10.54VAVEE52 pKa = 4.15AFRR55 pKa = 11.84LGYY58 pKa = 10.25EE59 pKa = 4.01VTDD62 pKa = 3.98PEE64 pKa = 4.3EE65 pKa = 5.63LEE67 pKa = 5.16LEE69 pKa = 4.66DD70 pKa = 4.45GSKK73 pKa = 11.04VMCCDD78 pKa = 4.05IISEE82 pKa = 4.3LALNAALLDD91 pKa = 3.97EE92 pKa = 4.52QVEE95 pKa = 4.29QLVKK99 pKa = 10.66LAGKK103 pKa = 10.19FNVDD107 pKa = 2.85YY108 pKa = 10.7DD109 pKa = 3.37GWGTYY114 pKa = 10.12FEE116 pKa = 5.56DD117 pKa = 4.97PNAEE121 pKa = 4.4DD122 pKa = 4.13PQSDD126 pKa = 4.1DD127 pKa = 5.25DD128 pKa = 5.82YY129 pKa = 11.92VDD131 pKa = 4.04EE132 pKa = 6.24DD133 pKa = 4.64DD134 pKa = 5.86DD135 pKa = 4.65GVRR138 pKa = 11.84HH139 pKa = 6.05
Molecular weight: 15.81 kDa
Isoelectric point according different methods:
Protein with the highest isoelectric point:
>tr|A0A2G8E5D7|A0A2G8E5D7_9GAMM UTP--glucose-1-phosphate uridylyltransferase OS=Erwinia sp. OLSSP12 OX=1912096 GN=BK416_14110 PE=3 SV=1
RR1 pKa = 7.86VLTMAVNLNRR11 pKa = 11.84LTTGTMNVNAGHH23 pKa = 6.64KK24 pKa = 7.69RR25 pKa = 11.84TSKK28 pKa = 10.78ARR30 pKa = 11.84IIHH33 pKa = 5.9QIQPIRR39 pKa = 11.84GITRR43 pKa = 3.65
RR1 pKa = 7.86VLTMAVNLNRR11 pKa = 11.84LTTGTMNVNAGHH23 pKa = 6.64KK24 pKa = 7.69RR25 pKa = 11.84TSKK28 pKa = 10.78ARR30 pKa = 11.84IIHH33 pKa = 5.9QIQPIRR39 pKa = 11.84GITRR43 pKa = 3.65
Molecular weight: 4.84 kDa
Isoelectric point according different methods:
Peptides (in silico digests for buttom-up proteomics)
Below you can find in silico digests of the whole proteome with Trypsin, Chymotrypsin, Trypsin+LysC, LysN, ArgC proteases suitable for different mass spec machines.| Try ESI |
 |
|---|
| ChTry ESI |
|
|---|
| ArgC ESI |
|
|---|
| LysN ESI |
|
|---|
| TryLysC ESI |
|
|---|
| Try MALDI |
|
|---|
| ChTry MALDI |
|
|---|
| ArgC MALDI |
|
|---|
| LysN MALDI |
|
|---|
| TryLysC MALDI |
|
|---|
| Try LTQ |
|
|---|
| ChTry LTQ |
|
|---|
| ArgC LTQ |
|
|---|
| LysN LTQ |
|
|---|
| TryLysC LTQ |
|
|---|
| Try MSlow |
|
|---|
| ChTry MSlow |
|
|---|
| ArgC MSlow |
|
|---|
| LysN MSlow |
|
|---|
| TryLysC MSlow |
|
|---|
| Try MShigh |
|
|---|
| ChTry MShigh |
|
|---|
| ArgC MShigh |
|
|---|
| LysN MShigh |
|
|---|
| TryLysC MShigh |
|
|---|
General Statistics
Number of major isoforms |
Number of additional isoforms |
Number of all proteins |
Number of amino acids |
Min. Seq. Length |
Max. Seq. Length |
Avg. Seq. Length |
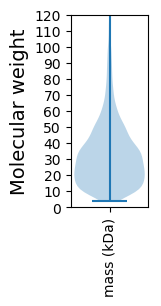
Avg. Mol. Weight |
|---|---|---|---|---|---|---|---|
0 |
1038597 |
34 |
1725 |
307.0 |
33.94 |
Amino acid frequency
Ala |
Cys |
Asp |
Glu |
Phe |
Gly |
His |
Ile |
Lys |
Leu |
|---|---|---|---|---|---|---|---|---|---|
10.099 ± 0.051 | 1.102 ± 0.015 |
5.164 ± 0.033 | 5.132 ± 0.043 |
3.727 ± 0.028 | 7.32 ± 0.04 |
2.364 ± 0.022 | 5.702 ± 0.037 |
3.921 ± 0.038 | 11.114 ± 0.055 |
Met |
Asn |
Gln |
Pro |
Arg |
Ser |
Thr |
Val |
Trp |
Tyr |
|---|---|---|---|---|---|---|---|---|---|
2.631 ± 0.021 | 3.684 ± 0.031 |
4.557 ± 0.029 | 5.061 ± 0.046 |
6.103 ± 0.039 | 6.153 ± 0.034 |
5.166 ± 0.033 | 6.747 ± 0.033 |
1.501 ± 0.02 | 2.75 ± 0.023 |
Most of the basic statistics you can see at this page can be downloaded from this CSV file
See this proteome in:

Proteome-pI is available under Creative Commons Attribution-NoDerivs license, for more details see here
| Reference: Kozlowski LP. Proteome-pI 2.0: Proteome Isoelectric Point Database Update. Nucleic Acids Res. 2021, doi: 10.1093/nar/gkab944 | Contact: Lukasz P. Kozlowski |