Gulosibacter molinativorax
Taxonomy: cellular organisms; Bacteria; Terrabacteria group; Actinobacteria; Actinomycetia; Micrococcales; Microbacteriaceae; Gulosibacter
Average proteome isoelectric point is 5.87
Get precalculated fractions of proteins

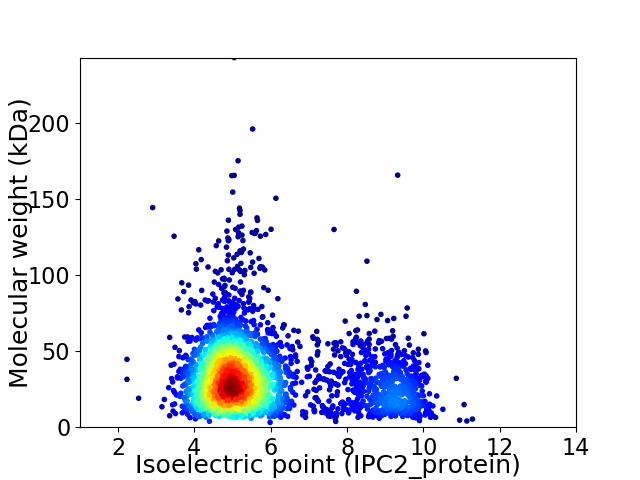
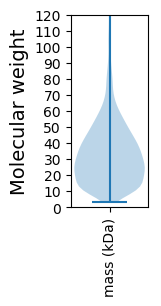
Virtual 2D-PAGE plot for 3115 proteins (isoelectric point calculated using IPC2_protein)
Get csv file with sequences according to given criteria:
* You can choose from 21 different methods for calculating isoelectric point
Summary statistics related to proteome-wise predictions


Protein with the lowest isoelectric point:
>tr|A0A2P7AFA5|A0A2P7AFA5_9MICO DUF3093 domain-containing protein OS=Gulosibacter molinativorax OX=256821 GN=GMOLON4_07830 PE=4 SV=1
MM1 pKa = 6.5QRR3 pKa = 11.84RR4 pKa = 11.84RR5 pKa = 11.84IANRR9 pKa = 11.84MWLAGAAVAALLLSGCQQVSQSDD32 pKa = 3.64QTEE35 pKa = 4.12VDD37 pKa = 3.33LGTPVAGEE45 pKa = 3.96VPEE48 pKa = 4.58GVFEE52 pKa = 4.3GTTLTFAGSGGIFQDD67 pKa = 3.96GQAAAAWDD75 pKa = 3.91PFAEE79 pKa = 4.27QTGATFLQDD88 pKa = 3.64AYY90 pKa = 11.21DD91 pKa = 4.21PGKK94 pKa = 10.32LKK96 pKa = 11.27AMVDD100 pKa = 3.72SGNTTWDD107 pKa = 3.8LVNATQFDD115 pKa = 3.9TAQYY119 pKa = 10.65CGTLYY124 pKa = 11.07EE125 pKa = 4.42EE126 pKa = 5.32LDD128 pKa = 3.64YY129 pKa = 11.67SQIDD133 pKa = 3.46ISNVPEE139 pKa = 3.93GTITDD144 pKa = 3.83DD145 pKa = 4.46CMVPQILYY153 pKa = 11.0GLVLVYY159 pKa = 9.97NTDD162 pKa = 3.32TFGDD166 pKa = 3.95NPPTTAADD174 pKa = 3.83FFDD177 pKa = 4.0TEE179 pKa = 4.35KK180 pKa = 11.01FPGQRR185 pKa = 11.84TVSASPYY192 pKa = 9.66VDD194 pKa = 2.97PQMFEE199 pKa = 4.13FAMVADD205 pKa = 5.12DD206 pKa = 5.15KK207 pKa = 11.03DD208 pKa = 4.12TSSVTADD215 pKa = 4.55DD216 pKa = 4.36IVPALDD222 pKa = 3.38KK223 pKa = 11.07YY224 pKa = 11.17RR225 pKa = 11.84EE226 pKa = 4.22IEE228 pKa = 4.21DD229 pKa = 4.77SLITWTSGAQAQQQLEE245 pKa = 4.25SGEE248 pKa = 4.17AVMGLVWSGRR258 pKa = 11.84GYY260 pKa = 10.74GAANAGAPVAAMWDD274 pKa = 3.34EE275 pKa = 3.92WMVMVDD281 pKa = 3.08STAIPKK287 pKa = 10.34GSQNLQAAHH296 pKa = 6.16SAINYY301 pKa = 9.21YY302 pKa = 10.51GGAEE306 pKa = 4.1QQTKK310 pKa = 9.23MSEE313 pKa = 4.05LTSYY317 pKa = 11.46GPINVNAKK325 pKa = 9.52PDD327 pKa = 3.59LSGEE331 pKa = 4.15LGNWMTTDD339 pKa = 3.44HH340 pKa = 7.63LDD342 pKa = 3.32TGHH345 pKa = 6.21YY346 pKa = 9.53PNVDD350 pKa = 3.81FWVEE354 pKa = 3.96NYY356 pKa = 9.18DD357 pKa = 3.77ALQSAWSSWVTTGG370 pKa = 4.48
MM1 pKa = 6.5QRR3 pKa = 11.84RR4 pKa = 11.84RR5 pKa = 11.84IANRR9 pKa = 11.84MWLAGAAVAALLLSGCQQVSQSDD32 pKa = 3.64QTEE35 pKa = 4.12VDD37 pKa = 3.33LGTPVAGEE45 pKa = 3.96VPEE48 pKa = 4.58GVFEE52 pKa = 4.3GTTLTFAGSGGIFQDD67 pKa = 3.96GQAAAAWDD75 pKa = 3.91PFAEE79 pKa = 4.27QTGATFLQDD88 pKa = 3.64AYY90 pKa = 11.21DD91 pKa = 4.21PGKK94 pKa = 10.32LKK96 pKa = 11.27AMVDD100 pKa = 3.72SGNTTWDD107 pKa = 3.8LVNATQFDD115 pKa = 3.9TAQYY119 pKa = 10.65CGTLYY124 pKa = 11.07EE125 pKa = 4.42EE126 pKa = 5.32LDD128 pKa = 3.64YY129 pKa = 11.67SQIDD133 pKa = 3.46ISNVPEE139 pKa = 3.93GTITDD144 pKa = 3.83DD145 pKa = 4.46CMVPQILYY153 pKa = 11.0GLVLVYY159 pKa = 9.97NTDD162 pKa = 3.32TFGDD166 pKa = 3.95NPPTTAADD174 pKa = 3.83FFDD177 pKa = 4.0TEE179 pKa = 4.35KK180 pKa = 11.01FPGQRR185 pKa = 11.84TVSASPYY192 pKa = 9.66VDD194 pKa = 2.97PQMFEE199 pKa = 4.13FAMVADD205 pKa = 5.12DD206 pKa = 5.15KK207 pKa = 11.03DD208 pKa = 4.12TSSVTADD215 pKa = 4.55DD216 pKa = 4.36IVPALDD222 pKa = 3.38KK223 pKa = 11.07YY224 pKa = 11.17RR225 pKa = 11.84EE226 pKa = 4.22IEE228 pKa = 4.21DD229 pKa = 4.77SLITWTSGAQAQQQLEE245 pKa = 4.25SGEE248 pKa = 4.17AVMGLVWSGRR258 pKa = 11.84GYY260 pKa = 10.74GAANAGAPVAAMWDD274 pKa = 3.34EE275 pKa = 3.92WMVMVDD281 pKa = 3.08STAIPKK287 pKa = 10.34GSQNLQAAHH296 pKa = 6.16SAINYY301 pKa = 9.21YY302 pKa = 10.51GGAEE306 pKa = 4.1QQTKK310 pKa = 9.23MSEE313 pKa = 4.05LTSYY317 pKa = 11.46GPINVNAKK325 pKa = 9.52PDD327 pKa = 3.59LSGEE331 pKa = 4.15LGNWMTTDD339 pKa = 3.44HH340 pKa = 7.63LDD342 pKa = 3.32TGHH345 pKa = 6.21YY346 pKa = 9.53PNVDD350 pKa = 3.81FWVEE354 pKa = 3.96NYY356 pKa = 9.18DD357 pKa = 3.77ALQSAWSSWVTTGG370 pKa = 4.48
Molecular weight: 39.98 kDa
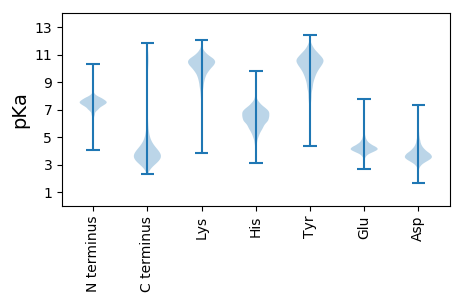
Isoelectric point according different methods:
Protein with the highest isoelectric point:
>tr|A0A2P7AEK4|A0A2P7AEK4_9MICO Type II toxin-antitoxin system RelE/ParE family toxin OS=Gulosibacter molinativorax OX=256821 GN=GMOLON4_08800 PE=4 SV=1
MM1 pKa = 7.69SKK3 pKa = 9.0RR4 pKa = 11.84TFQPNNRR11 pKa = 11.84RR12 pKa = 11.84RR13 pKa = 11.84SKK15 pKa = 10.39KK16 pKa = 9.03HH17 pKa = 4.36GFRR20 pKa = 11.84LRR22 pKa = 11.84MRR24 pKa = 11.84TRR26 pKa = 11.84AGRR29 pKa = 11.84AILASRR35 pKa = 11.84RR36 pKa = 11.84SKK38 pKa = 10.36GRR40 pKa = 11.84KK41 pKa = 8.53VLSAA45 pKa = 4.05
MM1 pKa = 7.69SKK3 pKa = 9.0RR4 pKa = 11.84TFQPNNRR11 pKa = 11.84RR12 pKa = 11.84RR13 pKa = 11.84SKK15 pKa = 10.39KK16 pKa = 9.03HH17 pKa = 4.36GFRR20 pKa = 11.84LRR22 pKa = 11.84MRR24 pKa = 11.84TRR26 pKa = 11.84AGRR29 pKa = 11.84AILASRR35 pKa = 11.84RR36 pKa = 11.84SKK38 pKa = 10.36GRR40 pKa = 11.84KK41 pKa = 8.53VLSAA45 pKa = 4.05
Molecular weight: 5.33 kDa
Isoelectric point according different methods:
Peptides (in silico digests for buttom-up proteomics)
Below you can find in silico digests of the whole proteome with Trypsin, Chymotrypsin, Trypsin+LysC, LysN, ArgC proteases suitable for different mass spec machines.| Try ESI |
 |
|---|
| ChTry ESI |
 |
|---|
| ArgC ESI |
 |
|---|
| LysN ESI |
 |
|---|
| TryLysC ESI |
 |
|---|
| Try MALDI |
 |
|---|
| ChTry MALDI |
 |
|---|
| ArgC MALDI |
 |
|---|
| LysN MALDI |
 |
|---|
| TryLysC MALDI |
 |
|---|
| Try LTQ |
 |
|---|
| ChTry LTQ |
 |
|---|
| ArgC LTQ |
 |
|---|
| LysN LTQ |
 |
|---|
| TryLysC LTQ |
 |
|---|
| Try MSlow |
 |
|---|
| ChTry MSlow |
 |
|---|
| ArgC MSlow |
 |
|---|
| LysN MSlow |
 |
|---|
| TryLysC MSlow |
 |
|---|
| Try MShigh |
 |
|---|
| ChTry MShigh |
 |
|---|
| ArgC MShigh |
 |
|---|
| LysN MShigh |
 |
|---|
| TryLysC MShigh |
 |
|---|
General Statistics
Number of major isoforms |
Number of additional isoforms |
Number of all proteins |
Number of amino acids |
Min. Seq. Length |
Max. Seq. Length |
Avg. Seq. Length |
Avg. Mol. Weight |
|---|---|---|---|---|---|---|---|
0 |
1006633 |
29 |
2245 |
323.2 |
34.96 |
Amino acid frequency
Ala |
Cys |
Asp |
Glu |
Phe |
Gly |
His |
Ile |
Lys |
Leu |
|---|---|---|---|---|---|---|---|---|---|
12.119 ± 0.066 | 0.487 ± 0.01 |
6.023 ± 0.038 | 6.676 ± 0.046 |
3.278 ± 0.024 | 8.524 ± 0.04 |
2.032 ± 0.022 | 5.135 ± 0.033 |
2.578 ± 0.03 | 9.779 ± 0.054 |
Met |
Asn |
Gln |
Pro |
Arg |
Ser |
Thr |
Val |
Trp |
Tyr |
|---|---|---|---|---|---|---|---|---|---|
1.994 ± 0.018 | 2.524 ± 0.025 |
5.006 ± 0.029 | 3.249 ± 0.03 |
6.894 ± 0.05 | 5.904 ± 0.032 |
6.041 ± 0.033 | 8.219 ± 0.04 |
1.436 ± 0.016 | 2.103 ± 0.022 |
Most of the basic statistics you can see at this page can be downloaded from this CSV file
Proteome-pI is available under Creative Commons Attribution-NoDerivs license, for more details see here
| Reference: Kozlowski LP. Proteome-pI 2.0: Proteome Isoelectric Point Database Update. Nucleic Acids Res. 2021, doi: 10.1093/nar/gkab944 | Contact: Lukasz P. Kozlowski |
