Ralstonia phage RSS1
Taxonomy: Viruses; Monodnaviria; Loebvirae; Hofneiviricota; Faserviricetes; Tubulavirales; Inoviridae; Restivirus; Ralstonia virus RSS1
Average proteome isoelectric point is 7.39
Get precalculated fractions of proteins

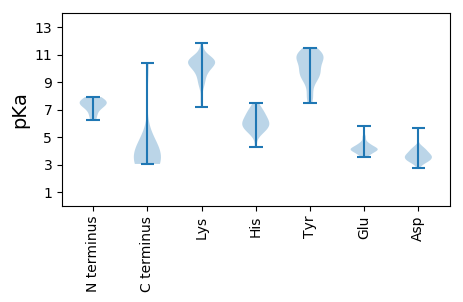
Virtual 2D-PAGE plot for 12 proteins (isoelectric point calculated using IPC2_protein)
Get csv file with sequences according to given criteria:
* You can choose from 21 different methods for calculating isoelectric point
Summary statistics related to proteome-wise predictions


Protein with the lowest isoelectric point:
>tr|A0JC27|A0JC27_9VIRU Uncharacterized protein OS=Ralstonia phage RSS1 OX=384360 PE=4 SV=1
MM1 pKa = 7.59RR2 pKa = 11.84VLVLLLCWWASSAWASTIPLIPPPNIVLTGTGYY35 pKa = 8.68VTTGAVTLSEE45 pKa = 4.26VATATEE51 pKa = 3.73MRR53 pKa = 11.84AAVGAGAATIAATMTVGEE71 pKa = 4.37GAAAVALAALRR82 pKa = 11.84ATPAIATATSLAYY95 pKa = 10.22LAQLGIQKK103 pKa = 10.22CLDD106 pKa = 3.79GTWCTSKK113 pKa = 10.67RR114 pKa = 11.84SPAAGDD120 pKa = 3.22TGFNGWGWTYY130 pKa = 11.08GYY132 pKa = 7.89NTSATGGNIANGVAASPGAACSAMLAADD160 pKa = 5.01AYY162 pKa = 11.27LAGQKK167 pKa = 10.68AKK169 pKa = 10.24FAGMKK174 pKa = 9.0ATGNGTSYY182 pKa = 10.51EE183 pKa = 4.07CHH185 pKa = 5.33YY186 pKa = 10.2TNDD189 pKa = 3.75GGDD192 pKa = 3.15NFYY195 pKa = 11.16AGTSQASSCVDD206 pKa = 3.64GYY208 pKa = 10.97VVSGSACVPDD218 pKa = 3.98PAGPTVGASDD228 pKa = 4.38ADD230 pKa = 3.82WNKK233 pKa = 10.46GLTYY237 pKa = 9.63PLPAGVASDD246 pKa = 3.39MAAAKK251 pKa = 10.52VPIPVKK257 pKa = 9.49LTPSTTPVNVNLSDD271 pKa = 4.25PYY273 pKa = 11.06VDD275 pKa = 3.41PVTGKK280 pKa = 10.3RR281 pKa = 11.84YY282 pKa = 9.86RR283 pKa = 11.84DD284 pKa = 3.59VATVTPNSDD293 pKa = 2.78GKK295 pKa = 8.9TATLTTGKK303 pKa = 10.15QEE305 pKa = 3.53VDD307 pKa = 3.25ANGNPATDD315 pKa = 3.73PATGNGKK322 pKa = 9.89APEE325 pKa = 4.29KK326 pKa = 10.6QDD328 pKa = 3.76DD329 pKa = 3.81QCSGHH334 pKa = 5.4EE335 pKa = 4.06TRR337 pKa = 11.84MGCIEE342 pKa = 4.1QGEE345 pKa = 4.53IPDD348 pKa = 4.33GPDD351 pKa = 3.42LKK353 pKa = 10.65EE354 pKa = 3.58QQVNVKK360 pKa = 7.96VTPDD364 pKa = 3.69SGWGADD370 pKa = 3.69TAPCPSDD377 pKa = 3.24LTASIHH383 pKa = 5.69GMPISWSLKK392 pKa = 8.3PVCDD396 pKa = 3.58GADD399 pKa = 3.03MFRR402 pKa = 11.84PVIIACAWLGAALIVIGVGRR422 pKa = 11.84KK423 pKa = 9.67GEE425 pKa = 4.05EE426 pKa = 3.72
MM1 pKa = 7.59RR2 pKa = 11.84VLVLLLCWWASSAWASTIPLIPPPNIVLTGTGYY35 pKa = 8.68VTTGAVTLSEE45 pKa = 4.26VATATEE51 pKa = 3.73MRR53 pKa = 11.84AAVGAGAATIAATMTVGEE71 pKa = 4.37GAAAVALAALRR82 pKa = 11.84ATPAIATATSLAYY95 pKa = 10.22LAQLGIQKK103 pKa = 10.22CLDD106 pKa = 3.79GTWCTSKK113 pKa = 10.67RR114 pKa = 11.84SPAAGDD120 pKa = 3.22TGFNGWGWTYY130 pKa = 11.08GYY132 pKa = 7.89NTSATGGNIANGVAASPGAACSAMLAADD160 pKa = 5.01AYY162 pKa = 11.27LAGQKK167 pKa = 10.68AKK169 pKa = 10.24FAGMKK174 pKa = 9.0ATGNGTSYY182 pKa = 10.51EE183 pKa = 4.07CHH185 pKa = 5.33YY186 pKa = 10.2TNDD189 pKa = 3.75GGDD192 pKa = 3.15NFYY195 pKa = 11.16AGTSQASSCVDD206 pKa = 3.64GYY208 pKa = 10.97VVSGSACVPDD218 pKa = 3.98PAGPTVGASDD228 pKa = 4.38ADD230 pKa = 3.82WNKK233 pKa = 10.46GLTYY237 pKa = 9.63PLPAGVASDD246 pKa = 3.39MAAAKK251 pKa = 10.52VPIPVKK257 pKa = 9.49LTPSTTPVNVNLSDD271 pKa = 4.25PYY273 pKa = 11.06VDD275 pKa = 3.41PVTGKK280 pKa = 10.3RR281 pKa = 11.84YY282 pKa = 9.86RR283 pKa = 11.84DD284 pKa = 3.59VATVTPNSDD293 pKa = 2.78GKK295 pKa = 8.9TATLTTGKK303 pKa = 10.15QEE305 pKa = 3.53VDD307 pKa = 3.25ANGNPATDD315 pKa = 3.73PATGNGKK322 pKa = 9.89APEE325 pKa = 4.29KK326 pKa = 10.6QDD328 pKa = 3.76DD329 pKa = 3.81QCSGHH334 pKa = 5.4EE335 pKa = 4.06TRR337 pKa = 11.84MGCIEE342 pKa = 4.1QGEE345 pKa = 4.53IPDD348 pKa = 4.33GPDD351 pKa = 3.42LKK353 pKa = 10.65EE354 pKa = 3.58QQVNVKK360 pKa = 7.96VTPDD364 pKa = 3.69SGWGADD370 pKa = 3.69TAPCPSDD377 pKa = 3.24LTASIHH383 pKa = 5.69GMPISWSLKK392 pKa = 8.3PVCDD396 pKa = 3.58GADD399 pKa = 3.03MFRR402 pKa = 11.84PVIIACAWLGAALIVIGVGRR422 pKa = 11.84KK423 pKa = 9.67GEE425 pKa = 4.05EE426 pKa = 3.72
Molecular weight: 43.18 kDa
Isoelectric point according different methods:
Protein with the highest isoelectric point:
>tr|A0JC31|A0JC31_9VIRU Uncharacterized protein OS=Ralstonia phage RSS1 OX=384360 PE=4 SV=1
MM1 pKa = 6.98TRR3 pKa = 11.84YY4 pKa = 9.54VHH6 pKa = 6.68TGPPTYY12 pKa = 10.34KK13 pKa = 10.34HH14 pKa = 6.42PLSCKK19 pKa = 9.57PAFEE23 pKa = 4.24TLTIFGCAGCGGSLRR38 pKa = 11.84VPMLRR43 pKa = 11.84CSEE46 pKa = 4.14QPKK49 pKa = 10.4SAVSDD54 pKa = 4.15DD55 pKa = 3.62EE56 pKa = 4.5LKK58 pKa = 11.0AVARR62 pKa = 11.84EE63 pKa = 3.67IRR65 pKa = 11.84HH66 pKa = 5.95LYY68 pKa = 7.49WHH70 pKa = 6.76IRR72 pKa = 11.84TLRR75 pKa = 11.84RR76 pKa = 11.84GYY78 pKa = 10.46QDD80 pKa = 3.34AARR83 pKa = 11.84HH84 pKa = 5.24RR85 pKa = 11.84YY86 pKa = 7.58YY87 pKa = 10.94RR88 pKa = 11.84KK89 pKa = 9.43IRR91 pKa = 11.84TKK93 pKa = 10.29KK94 pKa = 10.14KK95 pKa = 10.21RR96 pKa = 11.84LLEE99 pKa = 4.03YY100 pKa = 10.81NRR102 pKa = 11.84LTRR105 pKa = 11.84ARR107 pKa = 11.84GKK109 pKa = 10.35
MM1 pKa = 6.98TRR3 pKa = 11.84YY4 pKa = 9.54VHH6 pKa = 6.68TGPPTYY12 pKa = 10.34KK13 pKa = 10.34HH14 pKa = 6.42PLSCKK19 pKa = 9.57PAFEE23 pKa = 4.24TLTIFGCAGCGGSLRR38 pKa = 11.84VPMLRR43 pKa = 11.84CSEE46 pKa = 4.14QPKK49 pKa = 10.4SAVSDD54 pKa = 4.15DD55 pKa = 3.62EE56 pKa = 4.5LKK58 pKa = 11.0AVARR62 pKa = 11.84EE63 pKa = 3.67IRR65 pKa = 11.84HH66 pKa = 5.95LYY68 pKa = 7.49WHH70 pKa = 6.76IRR72 pKa = 11.84TLRR75 pKa = 11.84RR76 pKa = 11.84GYY78 pKa = 10.46QDD80 pKa = 3.34AARR83 pKa = 11.84HH84 pKa = 5.24RR85 pKa = 11.84YY86 pKa = 7.58YY87 pKa = 10.94RR88 pKa = 11.84KK89 pKa = 9.43IRR91 pKa = 11.84TKK93 pKa = 10.29KK94 pKa = 10.14KK95 pKa = 10.21RR96 pKa = 11.84LLEE99 pKa = 4.03YY100 pKa = 10.81NRR102 pKa = 11.84LTRR105 pKa = 11.84ARR107 pKa = 11.84GKK109 pKa = 10.35
Molecular weight: 12.79 kDa
Isoelectric point according different methods:
Peptides (in silico digests for buttom-up proteomics)
Below you can find in silico digests of the whole proteome with Trypsin, Chymotrypsin, Trypsin+LysC, LysN, ArgC proteases suitable for different mass spec machines.| Try ESI |
 |
|---|
| ChTry ESI |
|
|---|
| ArgC ESI |
|
|---|
| LysN ESI |
|
|---|
| TryLysC ESI |
|
|---|
| Try MALDI |
|
|---|
| ChTry MALDI |
|
|---|
| ArgC MALDI |
|
|---|
| LysN MALDI |
|
|---|
| TryLysC MALDI |
|
|---|
| Try LTQ |
|
|---|
| ChTry LTQ |
|
|---|
| ArgC LTQ |
|
|---|
| LysN LTQ |
|
|---|
| TryLysC LTQ |
|
|---|
| Try MSlow |
|
|---|
| ChTry MSlow |
|
|---|
| ArgC MSlow |
|
|---|
| LysN MSlow |
|
|---|
| TryLysC MSlow |
|
|---|
| Try MShigh |
|
|---|
| ChTry MShigh |
|
|---|
| ArgC MShigh |
|
|---|
| LysN MShigh |
|
|---|
| TryLysC MShigh |
|
|---|
General Statistics
Number of major isoforms |
Number of additional isoforms |
Number of all proteins |
Number of amino acids |
Min. Seq. Length |
Max. Seq. Length |
Avg. Seq. Length |
Avg. Mol. Weight |
|---|---|---|---|---|---|---|---|
0 |
2113 |
26 |
426 |
176.1 |
19.03 |
Amino acid frequency
Ala |
Cys |
Asp |
Glu |
Phe |
Gly |
His |
Ile |
Lys |
Leu |
|---|---|---|---|---|---|---|---|---|---|
12.92 ± 0.978 | 1.656 ± 0.285 |
5.111 ± 0.488 | 5.111 ± 0.883 |
2.508 ± 0.486 | 8.566 ± 0.881 |
1.609 ± 0.343 | 4.354 ± 0.504 |
5.111 ± 0.549 | 7.903 ± 0.766 |
Met |
Asn |
Gln |
Pro |
Arg |
Ser |
Thr |
Val |
Trp |
Tyr |
|---|---|---|---|---|---|---|---|---|---|
2.982 ± 0.304 | 1.988 ± 0.463 |
6.01 ± 0.88 | 3.881 ± 0.559 |
6.484 ± 1.224 | 5.348 ± 0.49 |
6.72 ± 0.827 | 7.383 ± 0.361 |
1.704 ± 0.322 | 2.65 ± 0.326 |
Most of the basic statistics you can see at this page can be downloaded from this CSV file
See this proteome in:

Proteome-pI is available under Creative Commons Attribution-NoDerivs license, for more details see here
| Reference: Kozlowski LP. Proteome-pI 2.0: Proteome Isoelectric Point Database Update. Nucleic Acids Res. 2021, doi: 10.1093/nar/gkab944 | Contact: Lukasz P. Kozlowski |