Pseudomonas phage vB_PaeP_C2-10_Ab09
Taxonomy: Viruses; Duplodnaviria; Heunggongvirae; Uroviricota; Caudoviricetes; Caudovirales; Schitoviridae; Migulavirinae; Litunavirus; Pseudomonas virus Ab09
Average proteome isoelectric point is 6.5
Get precalculated fractions of proteins
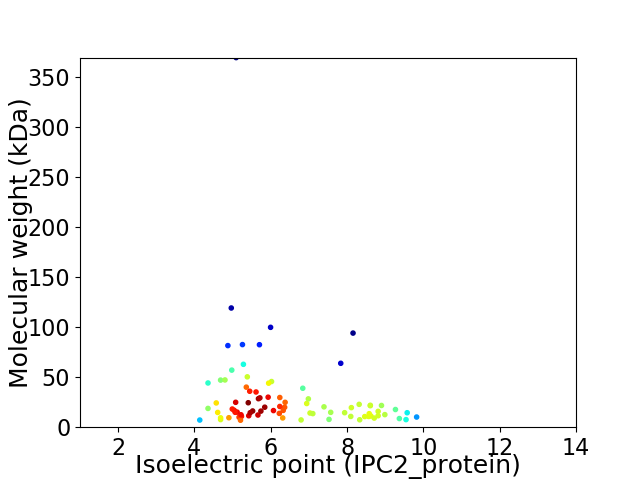
Virtual 2D-PAGE plot for 83 proteins (isoelectric point calculated using IPC2_protein)
Get csv file with sequences according to given criteria:
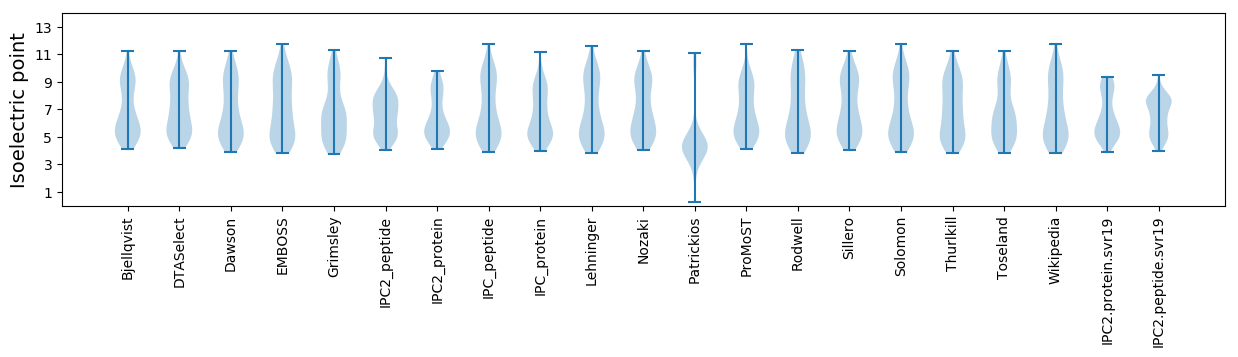
* You can choose from 21 different methods for calculating isoelectric point
Summary statistics related to proteome-wise predictions
Protein with the lowest isoelectric point:
>tr|X5L0X1|X5L0X1_9CAUD Uncharacterized protein OS=Pseudomonas phage vB_PaeP_C2-10_Ab09 OX=1476391 GN=ORF07 PE=4 SV=1
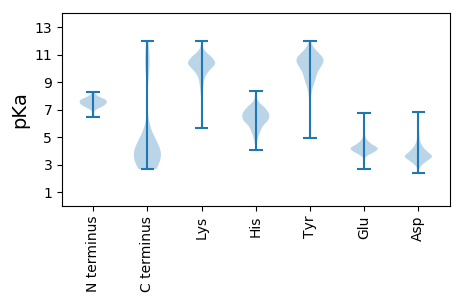
MM1 pKa = 7.68DD2 pKa = 3.85QNIYY6 pKa = 8.78TLLYY10 pKa = 10.35TNEE13 pKa = 4.22CLHH16 pKa = 7.1SIEE19 pKa = 4.55QEE21 pKa = 4.03FEE23 pKa = 4.03AVSDD27 pKa = 3.68EE28 pKa = 4.19VARR31 pKa = 11.84IKK33 pKa = 9.61ATAMCRR39 pKa = 11.84GQEE42 pKa = 4.22GLWSGIYY49 pKa = 9.14LTDD52 pKa = 3.9PQGEE56 pKa = 4.89AITFDD61 pKa = 3.84PFF63 pKa = 4.15
MM1 pKa = 7.68DD2 pKa = 3.85QNIYY6 pKa = 8.78TLLYY10 pKa = 10.35TNEE13 pKa = 4.22CLHH16 pKa = 7.1SIEE19 pKa = 4.55QEE21 pKa = 4.03FEE23 pKa = 4.03AVSDD27 pKa = 3.68EE28 pKa = 4.19VARR31 pKa = 11.84IKK33 pKa = 9.61ATAMCRR39 pKa = 11.84GQEE42 pKa = 4.22GLWSGIYY49 pKa = 9.14LTDD52 pKa = 3.9PQGEE56 pKa = 4.89AITFDD61 pKa = 3.84PFF63 pKa = 4.15
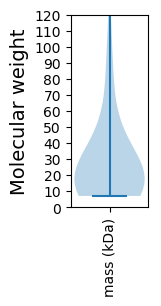
Molecular weight: 7.16 kDa
Isoelectric point according different methods:
Protein with the highest isoelectric point:
>tr|X5KIJ3|X5KIJ3_9CAUD Uncharacterized protein OS=Pseudomonas phage vB_PaeP_C2-10_Ab09 OX=1476391 GN=ORF09 PE=4 SV=1
MM1 pKa = 6.64NTLYY5 pKa = 10.85HH6 pKa = 7.09KK7 pKa = 9.67MQEE10 pKa = 4.32HH11 pKa = 5.76VCFVGFTRR19 pKa = 11.84AGMDD23 pKa = 3.24HH24 pKa = 7.16LSNRR28 pKa = 11.84VHH30 pKa = 6.2TFGEE34 pKa = 4.07ARR36 pKa = 11.84HH37 pKa = 6.56FITFNCRR44 pKa = 11.84PVTRR48 pKa = 11.84TSASSTAFPMKK59 pKa = 9.69GQRR62 pKa = 11.84MWKK65 pKa = 9.96
MM1 pKa = 6.64NTLYY5 pKa = 10.85HH6 pKa = 7.09KK7 pKa = 9.67MQEE10 pKa = 4.32HH11 pKa = 5.76VCFVGFTRR19 pKa = 11.84AGMDD23 pKa = 3.24HH24 pKa = 7.16LSNRR28 pKa = 11.84VHH30 pKa = 6.2TFGEE34 pKa = 4.07ARR36 pKa = 11.84HH37 pKa = 6.56FITFNCRR44 pKa = 11.84PVTRR48 pKa = 11.84TSASSTAFPMKK59 pKa = 9.69GQRR62 pKa = 11.84MWKK65 pKa = 9.96
Molecular weight: 7.59 kDa
Isoelectric point according different methods:
Peptides (in silico digests for buttom-up proteomics)
Below you can find in silico digests of the whole proteome with Trypsin, Chymotrypsin, Trypsin+LysC, LysN, ArgC proteases suitable for different mass spec machines.| Try ESI |
 |
|---|
| ChTry ESI |
|
|---|
| ArgC ESI |
|
|---|
| LysN ESI |
|
|---|
| TryLysC ESI |
|
|---|
| Try MALDI |
|
|---|
| ChTry MALDI |
|
|---|
| ArgC MALDI |
|
|---|
| LysN MALDI |
|
|---|
| TryLysC MALDI |
|
|---|
| Try LTQ |
|
|---|
| ChTry LTQ |
|
|---|
| ArgC LTQ |
|
|---|
| LysN LTQ |
|
|---|
| TryLysC LTQ |
|
|---|
| Try MSlow |
|
|---|
| ChTry MSlow |
|
|---|
| ArgC MSlow |
|
|---|
| LysN MSlow |
|
|---|
| TryLysC MSlow |
|
|---|
| Try MShigh |
|
|---|
| ChTry MShigh |
|
|---|
| ArgC MShigh |
|
|---|
| LysN MShigh |
|
|---|
| TryLysC MShigh |
|
|---|
General Statistics
Number of major isoforms |
Number of additional isoforms |
Number of all proteins |
Number of amino acids |
Min. Seq. Length |
Max. Seq. Length |
Avg. Seq. Length |
Avg. Mol. Weight |
|---|---|---|---|---|---|---|---|
0 |
22799 |
61 |
3398 |
274.7 |
30.64 |
Amino acid frequency
Ala |
Cys |
Asp |
Glu |
Phe |
Gly |
His |
Ile |
Lys |
Leu |
|---|---|---|---|---|---|---|---|---|---|
9.031 ± 0.57 | 0.952 ± 0.178 |
6.035 ± 0.166 | 6.816 ± 0.3 |
3.671 ± 0.177 | 6.82 ± 0.265 |
1.904 ± 0.224 | 4.869 ± 0.223 |
5.812 ± 0.28 | 8.878 ± 0.249 |
Met |
Asn |
Gln |
Pro |
Arg |
Ser |
Thr |
Val |
Trp |
Tyr |
|---|---|---|---|---|---|---|---|---|---|
3.215 ± 0.173 | 4.483 ± 0.156 |
4.211 ± 0.214 | 4.461 ± 0.261 |
5.562 ± 0.194 | 5.768 ± 0.221 |
5.996 ± 0.258 | 7.123 ± 0.224 |
1.281 ± 0.147 | 3.114 ± 0.2 |
Most of the basic statistics you can see at this page can be downloaded from this CSV file
See this proteome in:

Proteome-pI is available under Creative Commons Attribution-NoDerivs license, for more details see here
| Reference: Kozlowski LP. Proteome-pI 2.0: Proteome Isoelectric Point Database Update. Nucleic Acids Res. 2021, doi: 10.1093/nar/gkab944 | Contact: Lukasz P. Kozlowski |