Lysobacter tolerans
Taxonomy: cellular organisms; Bacteria; Proteobacteria; Gammaproteobacteria; Xanthomonadales; Xanthomonadaceae; Lysobacter
Average proteome isoelectric point is 6.56
Get precalculated fractions of proteins

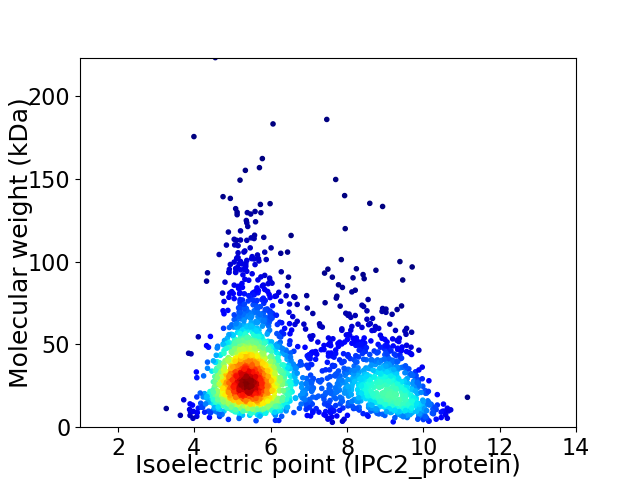
Virtual 2D-PAGE plot for 2386 proteins (isoelectric point calculated using IPC2_protein)
Get csv file with sequences according to given criteria:
* You can choose from 21 different methods for calculating isoelectric point
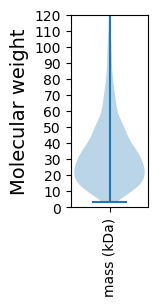
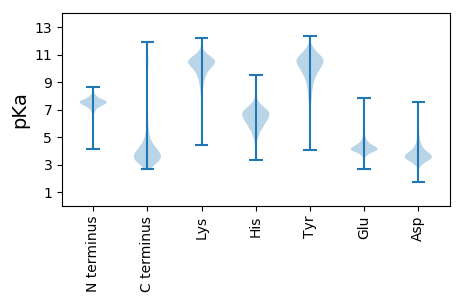
Summary statistics related to proteome-wise predictions


Protein with the lowest isoelectric point:
>tr|A0A1N6Y5H5|A0A1N6Y5H5_9GAMM NAD+ diphosphatase OS=Lysobacter tolerans OX=1604334 GN=SAMN05421546_2382 PE=4 SV=1
MM1 pKa = 7.12EE2 pKa = 4.35TQIDD6 pKa = 3.93TAAPGYY12 pKa = 9.14QQLDD16 pKa = 3.46APLTFTEE23 pKa = 3.99AAAAKK28 pKa = 9.81VRR30 pKa = 11.84EE31 pKa = 4.6LINEE35 pKa = 4.13EE36 pKa = 3.96GNADD40 pKa = 3.69LKK42 pKa = 11.17LRR44 pKa = 11.84VYY46 pKa = 10.15IQGGGCSGFQYY57 pKa = 10.65GFEE60 pKa = 4.0FDD62 pKa = 3.79EE63 pKa = 4.64NQAEE67 pKa = 4.33DD68 pKa = 4.25DD69 pKa = 4.3LAVITNGVTLLVDD82 pKa = 4.09PLSLQYY88 pKa = 11.38LMEE91 pKa = 4.22ATVDD95 pKa = 3.73YY96 pKa = 11.11TEE98 pKa = 4.47TLAGAQFSIRR108 pKa = 11.84NPNAKK113 pKa = 6.59TTCGCGSSFTVV124 pKa = 3.3
MM1 pKa = 7.12EE2 pKa = 4.35TQIDD6 pKa = 3.93TAAPGYY12 pKa = 9.14QQLDD16 pKa = 3.46APLTFTEE23 pKa = 3.99AAAAKK28 pKa = 9.81VRR30 pKa = 11.84EE31 pKa = 4.6LINEE35 pKa = 4.13EE36 pKa = 3.96GNADD40 pKa = 3.69LKK42 pKa = 11.17LRR44 pKa = 11.84VYY46 pKa = 10.15IQGGGCSGFQYY57 pKa = 10.65GFEE60 pKa = 4.0FDD62 pKa = 3.79EE63 pKa = 4.64NQAEE67 pKa = 4.33DD68 pKa = 4.25DD69 pKa = 4.3LAVITNGVTLLVDD82 pKa = 4.09PLSLQYY88 pKa = 11.38LMEE91 pKa = 4.22ATVDD95 pKa = 3.73YY96 pKa = 11.11TEE98 pKa = 4.47TLAGAQFSIRR108 pKa = 11.84NPNAKK113 pKa = 6.59TTCGCGSSFTVV124 pKa = 3.3
Molecular weight: 13.34 kDa
Isoelectric point according different methods:
Protein with the highest isoelectric point:
>tr|A0A1N6RQ83|A0A1N6RQ83_9GAMM Uncharacterized protein OS=Lysobacter tolerans OX=1604334 GN=SAMN05421546_1067 PE=4 SV=1
MM1 pKa = 7.33RR2 pKa = 11.84TNFVEE7 pKa = 4.4VRR9 pKa = 11.84SSRR12 pKa = 11.84LLKK15 pKa = 10.87NPLRR19 pKa = 11.84LYY21 pKa = 10.9GEE23 pKa = 4.07YY24 pKa = 10.1RR25 pKa = 11.84RR26 pKa = 11.84PDD28 pKa = 4.22DD29 pKa = 3.15KK30 pKa = 11.76TMIRR34 pKa = 11.84DD35 pKa = 3.08VRR37 pKa = 11.84APYY40 pKa = 11.04GEE42 pKa = 4.25TTTIRR47 pKa = 11.84GDD49 pKa = 3.32QVTIARR55 pKa = 11.84AAKK58 pKa = 9.84SPRR61 pKa = 11.84TFSMSRR67 pKa = 11.84APQLAGMQASFGALLSGDD85 pKa = 3.43EE86 pKa = 4.02RR87 pKa = 11.84AIARR91 pKa = 11.84DD92 pKa = 3.68FTLTTTGTRR101 pKa = 11.84AQWRR105 pKa = 11.84MQMLPKK111 pKa = 10.07QAALKK116 pKa = 10.39QYY118 pKa = 10.41VRR120 pKa = 11.84DD121 pKa = 3.2ITLYY125 pKa = 10.72GRR127 pKa = 11.84GSEE130 pKa = 4.1LRR132 pKa = 11.84CIEE135 pKa = 3.81TRR137 pKa = 11.84AVKK140 pKa = 10.63GEE142 pKa = 3.98EE143 pKa = 4.06VQRR146 pKa = 11.84TLLASAARR154 pKa = 11.84SVTAATTLDD163 pKa = 4.11KK164 pKa = 11.19LVMLCQQGSS173 pKa = 3.22
MM1 pKa = 7.33RR2 pKa = 11.84TNFVEE7 pKa = 4.4VRR9 pKa = 11.84SSRR12 pKa = 11.84LLKK15 pKa = 10.87NPLRR19 pKa = 11.84LYY21 pKa = 10.9GEE23 pKa = 4.07YY24 pKa = 10.1RR25 pKa = 11.84RR26 pKa = 11.84PDD28 pKa = 4.22DD29 pKa = 3.15KK30 pKa = 11.76TMIRR34 pKa = 11.84DD35 pKa = 3.08VRR37 pKa = 11.84APYY40 pKa = 11.04GEE42 pKa = 4.25TTTIRR47 pKa = 11.84GDD49 pKa = 3.32QVTIARR55 pKa = 11.84AAKK58 pKa = 9.84SPRR61 pKa = 11.84TFSMSRR67 pKa = 11.84APQLAGMQASFGALLSGDD85 pKa = 3.43EE86 pKa = 4.02RR87 pKa = 11.84AIARR91 pKa = 11.84DD92 pKa = 3.68FTLTTTGTRR101 pKa = 11.84AQWRR105 pKa = 11.84MQMLPKK111 pKa = 10.07QAALKK116 pKa = 10.39QYY118 pKa = 10.41VRR120 pKa = 11.84DD121 pKa = 3.2ITLYY125 pKa = 10.72GRR127 pKa = 11.84GSEE130 pKa = 4.1LRR132 pKa = 11.84CIEE135 pKa = 3.81TRR137 pKa = 11.84AVKK140 pKa = 10.63GEE142 pKa = 3.98EE143 pKa = 4.06VQRR146 pKa = 11.84TLLASAARR154 pKa = 11.84SVTAATTLDD163 pKa = 4.11KK164 pKa = 11.19LVMLCQQGSS173 pKa = 3.22
Molecular weight: 19.36 kDa
Isoelectric point according different methods:
Peptides (in silico digests for buttom-up proteomics)
Below you can find in silico digests of the whole proteome with Trypsin, Chymotrypsin, Trypsin+LysC, LysN, ArgC proteases suitable for different mass spec machines.| Try ESI |
 |
|---|
| ChTry ESI |
 |
|---|
| ArgC ESI |
 |
|---|
| LysN ESI |
 |
|---|
| TryLysC ESI |
 |
|---|
| Try MALDI |
 |
|---|
| ChTry MALDI |
 |
|---|
| ArgC MALDI |
 |
|---|
| LysN MALDI |
 |
|---|
| TryLysC MALDI |
 |
|---|
| Try LTQ |
 |
|---|
| ChTry LTQ |
 |
|---|
| ArgC LTQ |
 |
|---|
| LysN LTQ |
 |
|---|
| TryLysC LTQ |
 |
|---|
| Try MSlow |
 |
|---|
| ChTry MSlow |
 |
|---|
| ArgC MSlow |
 |
|---|
| LysN MSlow |
 |
|---|
| TryLysC MSlow |
 |
|---|
| Try MShigh |
 |
|---|
| ChTry MShigh |
 |
|---|
| ArgC MShigh |
 |
|---|
| LysN MShigh |
 |
|---|
| TryLysC MShigh |
 |
|---|
General Statistics
Number of major isoforms |
Number of additional isoforms |
Number of all proteins |
Number of amino acids |
Min. Seq. Length |
Max. Seq. Length |
Avg. Seq. Length |
Avg. Mol. Weight |
|---|---|---|---|---|---|---|---|
0 |
777642 |
28 |
2031 |
325.9 |
35.55 |
Amino acid frequency
Ala |
Cys |
Asp |
Glu |
Phe |
Gly |
His |
Ile |
Lys |
Leu |
|---|---|---|---|---|---|---|---|---|---|
12.191 ± 0.067 | 0.787 ± 0.015 |
6.117 ± 0.032 | 5.538 ± 0.044 |
3.404 ± 0.03 | 8.398 ± 0.048 |
2.244 ± 0.029 | 4.743 ± 0.032 |
3.414 ± 0.049 | 10.306 ± 0.063 |
Met |
Asn |
Gln |
Pro |
Arg |
Ser |
Thr |
Val |
Trp |
Tyr |
|---|---|---|---|---|---|---|---|---|---|
2.594 ± 0.024 | 2.75 ± 0.036 |
5.154 ± 0.033 | 3.682 ± 0.028 |
7.211 ± 0.046 | 5.373 ± 0.04 |
4.983 ± 0.039 | 7.268 ± 0.041 |
1.558 ± 0.024 | 2.286 ± 0.026 |
Most of the basic statistics you can see at this page can be downloaded from this CSV file
Proteome-pI is available under Creative Commons Attribution-NoDerivs license, for more details see here
| Reference: Kozlowski LP. Proteome-pI 2.0: Proteome Isoelectric Point Database Update. Nucleic Acids Res. 2021, doi: 10.1093/nar/gkab944 | Contact: Lukasz P. Kozlowski |
