marine gamma proteobacterium HTCC2148
Taxonomy: cellular organisms; Bacteria; Proteobacteria; Gammaproteobacteria; Cellvibrionales; Halieaceae; unclassified Halieaceae
Average proteome isoelectric point is 5.72
Get precalculated fractions of proteins

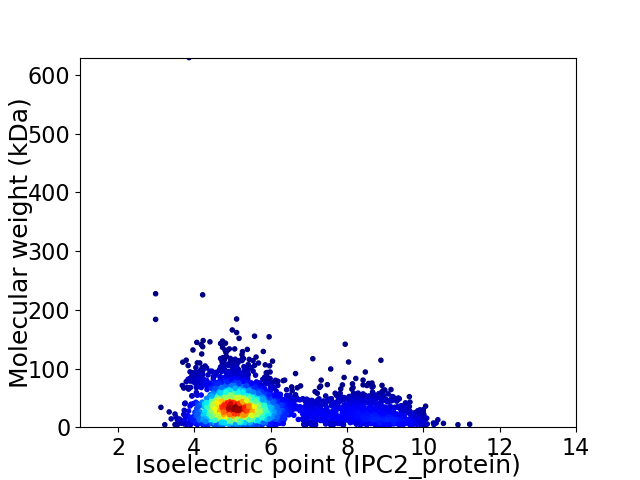
Virtual 2D-PAGE plot for 3825 proteins (isoelectric point calculated using IPC2_protein)
Get csv file with sequences according to given criteria:
* You can choose from 21 different methods for calculating isoelectric point
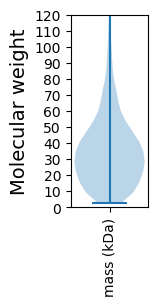
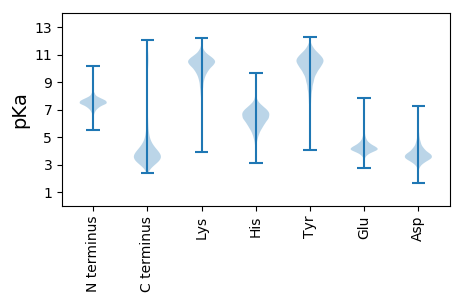
Summary statistics related to proteome-wise predictions


Protein with the lowest isoelectric point:
>tr|B7S188|B7S188_9GAMM Uncharacterized protein OS=marine gamma proteobacterium HTCC2148 OX=247634 GN=GPB2148_1302 PE=4 SV=1
MM1 pKa = 7.68AFFSTANIANAVVGQNDD18 pKa = 2.93IDD20 pKa = 3.7EE21 pKa = 4.8ARR23 pKa = 11.84FITLPFDD30 pKa = 3.57EE31 pKa = 5.54VFDD34 pKa = 4.09NTGLQPDD41 pKa = 4.6AEE43 pKa = 4.06NDD45 pKa = 3.46ALGEE49 pKa = 4.18SFPEE53 pKa = 4.82DD54 pKa = 3.0ICEE57 pKa = 4.11EE58 pKa = 4.31GGVGYY63 pKa = 7.7MHH65 pKa = 6.87YY66 pKa = 10.09KK67 pKa = 10.0YY68 pKa = 10.63KK69 pKa = 9.4PTEE72 pKa = 3.83DD73 pKa = 3.26QMINIIASGDD83 pKa = 3.45DD84 pKa = 3.35TEE86 pKa = 4.59IRR88 pKa = 11.84VINADD93 pKa = 3.84VPPADD98 pKa = 5.39DD99 pKa = 4.18NSCLYY104 pKa = 10.94SQDD107 pKa = 4.67DD108 pKa = 3.74DD109 pKa = 3.76NLNYY113 pKa = 10.35FEE115 pKa = 6.19GDD117 pKa = 3.37DD118 pKa = 3.86VNGVFVPDD126 pKa = 3.56TDD128 pKa = 3.35EE129 pKa = 4.28SGNYY133 pKa = 9.11IPASDD138 pKa = 4.48DD139 pKa = 3.0NSARR143 pKa = 11.84VGEE146 pKa = 4.25APHH149 pKa = 7.4WYY151 pKa = 9.53QEE153 pKa = 4.9LYY155 pKa = 10.72FSDD158 pKa = 4.43PGACTHH164 pKa = 6.81ACSEE168 pKa = 4.15DD169 pKa = 3.58TKK171 pKa = 11.46DD172 pKa = 4.59GVEE175 pKa = 4.05LTANTTYY182 pKa = 10.5IIQIAANYY190 pKa = 9.27SGRR193 pKa = 11.84GNLGDD198 pKa = 3.79EE199 pKa = 4.94CDD201 pKa = 3.81NTTLPDD207 pKa = 4.54GSCEE211 pKa = 3.9GDD213 pKa = 3.04NRR215 pKa = 11.84SPTFVSIAVGGLGAAKK231 pKa = 10.08DD232 pKa = 4.22RR233 pKa = 11.84PTLAPVTPVPTLPLFGLGILVSLLGFFGLRR263 pKa = 11.84KK264 pKa = 9.99LKK266 pKa = 10.32QQ267 pKa = 3.06
MM1 pKa = 7.68AFFSTANIANAVVGQNDD18 pKa = 2.93IDD20 pKa = 3.7EE21 pKa = 4.8ARR23 pKa = 11.84FITLPFDD30 pKa = 3.57EE31 pKa = 5.54VFDD34 pKa = 4.09NTGLQPDD41 pKa = 4.6AEE43 pKa = 4.06NDD45 pKa = 3.46ALGEE49 pKa = 4.18SFPEE53 pKa = 4.82DD54 pKa = 3.0ICEE57 pKa = 4.11EE58 pKa = 4.31GGVGYY63 pKa = 7.7MHH65 pKa = 6.87YY66 pKa = 10.09KK67 pKa = 10.0YY68 pKa = 10.63KK69 pKa = 9.4PTEE72 pKa = 3.83DD73 pKa = 3.26QMINIIASGDD83 pKa = 3.45DD84 pKa = 3.35TEE86 pKa = 4.59IRR88 pKa = 11.84VINADD93 pKa = 3.84VPPADD98 pKa = 5.39DD99 pKa = 4.18NSCLYY104 pKa = 10.94SQDD107 pKa = 4.67DD108 pKa = 3.74DD109 pKa = 3.76NLNYY113 pKa = 10.35FEE115 pKa = 6.19GDD117 pKa = 3.37DD118 pKa = 3.86VNGVFVPDD126 pKa = 3.56TDD128 pKa = 3.35EE129 pKa = 4.28SGNYY133 pKa = 9.11IPASDD138 pKa = 4.48DD139 pKa = 3.0NSARR143 pKa = 11.84VGEE146 pKa = 4.25APHH149 pKa = 7.4WYY151 pKa = 9.53QEE153 pKa = 4.9LYY155 pKa = 10.72FSDD158 pKa = 4.43PGACTHH164 pKa = 6.81ACSEE168 pKa = 4.15DD169 pKa = 3.58TKK171 pKa = 11.46DD172 pKa = 4.59GVEE175 pKa = 4.05LTANTTYY182 pKa = 10.5IIQIAANYY190 pKa = 9.27SGRR193 pKa = 11.84GNLGDD198 pKa = 3.79EE199 pKa = 4.94CDD201 pKa = 3.81NTTLPDD207 pKa = 4.54GSCEE211 pKa = 3.9GDD213 pKa = 3.04NRR215 pKa = 11.84SPTFVSIAVGGLGAAKK231 pKa = 10.08DD232 pKa = 4.22RR233 pKa = 11.84PTLAPVTPVPTLPLFGLGILVSLLGFFGLRR263 pKa = 11.84KK264 pKa = 9.99LKK266 pKa = 10.32QQ267 pKa = 3.06
Molecular weight: 28.73 kDa
Isoelectric point according different methods:
Protein with the highest isoelectric point:
>tr|B7S2A5|B7S2A5_9GAMM HemY N-terminal domain protein OS=marine gamma proteobacterium HTCC2148 OX=247634 GN=GPB2148_291 PE=4 SV=1
MM1 pKa = 7.45KK2 pKa = 9.51RR3 pKa = 11.84TFQPSVLKK11 pKa = 10.49RR12 pKa = 11.84KK13 pKa = 7.87RR14 pKa = 11.84THH16 pKa = 5.99GFRR19 pKa = 11.84SRR21 pKa = 11.84MATKK25 pKa = 10.44GGRR28 pKa = 11.84AVLNRR33 pKa = 11.84RR34 pKa = 11.84RR35 pKa = 11.84AKK37 pKa = 10.09GRR39 pKa = 11.84KK40 pKa = 8.87SLSAA44 pKa = 3.86
MM1 pKa = 7.45KK2 pKa = 9.51RR3 pKa = 11.84TFQPSVLKK11 pKa = 10.49RR12 pKa = 11.84KK13 pKa = 7.87RR14 pKa = 11.84THH16 pKa = 5.99GFRR19 pKa = 11.84SRR21 pKa = 11.84MATKK25 pKa = 10.44GGRR28 pKa = 11.84AVLNRR33 pKa = 11.84RR34 pKa = 11.84RR35 pKa = 11.84AKK37 pKa = 10.09GRR39 pKa = 11.84KK40 pKa = 8.87SLSAA44 pKa = 3.86
Molecular weight: 5.08 kDa
Isoelectric point according different methods:
Peptides (in silico digests for buttom-up proteomics)
Below you can find in silico digests of the whole proteome with Trypsin, Chymotrypsin, Trypsin+LysC, LysN, ArgC proteases suitable for different mass spec machines.| Try ESI |
 |
|---|
| ChTry ESI |
 |
|---|
| ArgC ESI |
 |
|---|
| LysN ESI |
 |
|---|
| TryLysC ESI |
 |
|---|
| Try MALDI |
 |
|---|
| ChTry MALDI |
 |
|---|
| ArgC MALDI |
 |
|---|
| LysN MALDI |
 |
|---|
| TryLysC MALDI |
 |
|---|
| Try LTQ |
 |
|---|
| ChTry LTQ |
 |
|---|
| ArgC LTQ |
 |
|---|
| LysN LTQ |
 |
|---|
| TryLysC LTQ |
 |
|---|
| Try MSlow |
 |
|---|
| ChTry MSlow |
 |
|---|
| ArgC MSlow |
 |
|---|
| LysN MSlow |
 |
|---|
| TryLysC MSlow |
 |
|---|
| Try MShigh |
 |
|---|
| ChTry MShigh |
 |
|---|
| ArgC MShigh |
 |
|---|
| LysN MShigh |
 |
|---|
| TryLysC MShigh |
 |
|---|
General Statistics
Number of major isoforms |
Number of additional isoforms |
Number of all proteins |
Number of amino acids |
Min. Seq. Length |
Max. Seq. Length |
Avg. Seq. Length |
Avg. Mol. Weight |
|---|---|---|---|---|---|---|---|
0 |
1273162 |
29 |
6746 |
332.9 |
36.56 |
Amino acid frequency
Ala |
Cys |
Asp |
Glu |
Phe |
Gly |
His |
Ile |
Lys |
Leu |
|---|---|---|---|---|---|---|---|---|---|
10.036 ± 0.042 | 1.075 ± 0.014 |
5.961 ± 0.037 | 6.413 ± 0.04 |
3.817 ± 0.026 | 8.043 ± 0.099 |
2.128 ± 0.022 | 5.368 ± 0.028 |
3.614 ± 0.027 | 10.299 ± 0.055 |
Met |
Asn |
Gln |
Pro |
Arg |
Ser |
Thr |
Val |
Trp |
Tyr |
|---|---|---|---|---|---|---|---|---|---|
2.637 ± 0.023 | 3.507 ± 0.025 |
4.506 ± 0.031 | 4.064 ± 0.026 |
5.631 ± 0.034 | 6.451 ± 0.037 |
5.113 ± 0.029 | 7.043 ± 0.032 |
1.394 ± 0.017 | 2.888 ± 0.022 |
Most of the basic statistics you can see at this page can be downloaded from this CSV file
Proteome-pI is available under Creative Commons Attribution-NoDerivs license, for more details see here
| Reference: Kozlowski LP. Proteome-pI 2.0: Proteome Isoelectric Point Database Update. Nucleic Acids Res. 2021, doi: 10.1093/nar/gkab944 | Contact: Lukasz P. Kozlowski |
