Tortoise microvirus 37
Taxonomy: Viruses; Monodnaviria; Sangervirae; Phixviricota; Malgrandaviricetes; Petitvirales; Microviridae; unclassified Microviridae
Average proteome isoelectric point is 7.49
Get precalculated fractions of proteins

Virtual 2D-PAGE plot for 7 proteins (isoelectric point calculated using IPC2_protein)
Get csv file with sequences according to given criteria:
* You can choose from 21 different methods for calculating isoelectric point
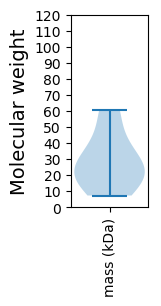
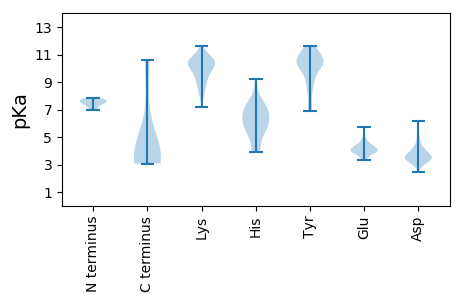
Summary statistics related to proteome-wise predictions


Protein with the lowest isoelectric point:
>tr|A0A4P8W5X0|A0A4P8W5X0_9VIRU Uncharacterized protein OS=Tortoise microvirus 37 OX=2583140 PE=4 SV=1
MM1 pKa = 7.6NYY3 pKa = 9.55VQLEE7 pKa = 4.22HH8 pKa = 7.48LSDD11 pKa = 3.34WVKK14 pKa = 10.42TMGADD19 pKa = 3.18QFFNVGDD26 pKa = 3.59QPRR29 pKa = 11.84AVVFRR34 pKa = 11.84VNNPLYY40 pKa = 10.41PMALEE45 pKa = 4.0ITADD49 pKa = 3.44SNYY52 pKa = 9.13WLLPFGYY59 pKa = 9.71DD60 pKa = 5.02DD61 pKa = 4.77NGQPLPDD68 pKa = 4.76PEE70 pKa = 4.76SGEE73 pKa = 4.19IPSLPGEE80 pKa = 4.73GPTEE84 pKa = 3.65RR85 pKa = 11.84ALARR89 pKa = 11.84LEE91 pKa = 4.11PGMNEE96 pKa = 4.03VAFTLPYY103 pKa = 8.45PALVKK108 pKa = 9.62FYY110 pKa = 10.58RR111 pKa = 11.84IGPDD115 pKa = 3.42GSVQPPGSQFQVRR128 pKa = 11.84RR129 pKa = 11.84YY130 pKa = 10.14DD131 pKa = 3.71LSQLVQEE138 pKa = 4.79SGEE141 pKa = 3.87PSYY144 pKa = 11.46VQIGSRR150 pKa = 11.84PTLDD154 pKa = 3.4PNYY157 pKa = 10.38QRR159 pKa = 11.84MEE161 pKa = 3.64MLMRR165 pKa = 11.84WNEE168 pKa = 3.91VQRR171 pKa = 11.84NRR173 pKa = 11.84AFQEE177 pKa = 3.56EE178 pKa = 4.45LAALRR183 pKa = 11.84DD184 pKa = 3.81EE185 pKa = 5.1FGNPTGTSTDD195 pKa = 2.62VDD197 pKa = 3.6IPVVEE202 pKa = 4.29DD203 pKa = 3.6TVPGGGAA210 pKa = 3.07
MM1 pKa = 7.6NYY3 pKa = 9.55VQLEE7 pKa = 4.22HH8 pKa = 7.48LSDD11 pKa = 3.34WVKK14 pKa = 10.42TMGADD19 pKa = 3.18QFFNVGDD26 pKa = 3.59QPRR29 pKa = 11.84AVVFRR34 pKa = 11.84VNNPLYY40 pKa = 10.41PMALEE45 pKa = 4.0ITADD49 pKa = 3.44SNYY52 pKa = 9.13WLLPFGYY59 pKa = 9.71DD60 pKa = 5.02DD61 pKa = 4.77NGQPLPDD68 pKa = 4.76PEE70 pKa = 4.76SGEE73 pKa = 4.19IPSLPGEE80 pKa = 4.73GPTEE84 pKa = 3.65RR85 pKa = 11.84ALARR89 pKa = 11.84LEE91 pKa = 4.11PGMNEE96 pKa = 4.03VAFTLPYY103 pKa = 8.45PALVKK108 pKa = 9.62FYY110 pKa = 10.58RR111 pKa = 11.84IGPDD115 pKa = 3.42GSVQPPGSQFQVRR128 pKa = 11.84RR129 pKa = 11.84YY130 pKa = 10.14DD131 pKa = 3.71LSQLVQEE138 pKa = 4.79SGEE141 pKa = 3.87PSYY144 pKa = 11.46VQIGSRR150 pKa = 11.84PTLDD154 pKa = 3.4PNYY157 pKa = 10.38QRR159 pKa = 11.84MEE161 pKa = 3.64MLMRR165 pKa = 11.84WNEE168 pKa = 3.91VQRR171 pKa = 11.84NRR173 pKa = 11.84AFQEE177 pKa = 3.56EE178 pKa = 4.45LAALRR183 pKa = 11.84DD184 pKa = 3.81EE185 pKa = 5.1FGNPTGTSTDD195 pKa = 2.62VDD197 pKa = 3.6IPVVEE202 pKa = 4.29DD203 pKa = 3.6TVPGGGAA210 pKa = 3.07
Molecular weight: 23.48 kDa
Isoelectric point according different methods:
Protein with the highest isoelectric point:
>tr|A0A4P8W685|A0A4P8W685_9VIRU Replication initiation protein OS=Tortoise microvirus 37 OX=2583140 PE=4 SV=1
MM1 pKa = 7.34EE2 pKa = 5.42AVSPPPLPKK11 pKa = 10.04KK12 pKa = 10.65ALTHH16 pKa = 6.56ADD18 pKa = 3.32AAAGLSDD25 pKa = 3.41TVYY28 pKa = 10.37IASADD33 pKa = 3.68YY34 pKa = 10.49RR35 pKa = 11.84RR36 pKa = 11.84LAIRR40 pKa = 11.84TPRR43 pKa = 11.84EE44 pKa = 3.5GAEE47 pKa = 3.61PDD49 pKa = 2.95IVRR52 pKa = 11.84FYY54 pKa = 11.51LAFQKK59 pKa = 11.01DD60 pKa = 3.43LVARR64 pKa = 11.84GFPFFATEE72 pKa = 3.97FLRR75 pKa = 11.84GRR77 pKa = 11.84DD78 pKa = 3.62RR79 pKa = 11.84QQALYY84 pKa = 10.68NAGNSKK90 pKa = 10.73AVFGRR95 pKa = 11.84SPHH98 pKa = 5.44NFGMAVDD105 pKa = 4.09IVHH108 pKa = 7.33CKK110 pKa = 10.3RR111 pKa = 11.84LWDD114 pKa = 4.38LKK116 pKa = 8.2PQEE119 pKa = 3.93WALIGLLGKK128 pKa = 9.8EE129 pKa = 4.28AARR132 pKa = 11.84KK133 pKa = 9.39QSIKK137 pKa = 10.45IEE139 pKa = 3.96WGGDD143 pKa = 2.46WFGRR147 pKa = 11.84GKK149 pKa = 10.56RR150 pKa = 11.84RR151 pKa = 11.84TSPGQVGWDD160 pKa = 3.49PAHH163 pKa = 7.09WEE165 pKa = 3.78LADD168 pKa = 3.21WAKK171 pKa = 10.59RR172 pKa = 11.84IRR174 pKa = 11.84GLL176 pKa = 3.91
MM1 pKa = 7.34EE2 pKa = 5.42AVSPPPLPKK11 pKa = 10.04KK12 pKa = 10.65ALTHH16 pKa = 6.56ADD18 pKa = 3.32AAAGLSDD25 pKa = 3.41TVYY28 pKa = 10.37IASADD33 pKa = 3.68YY34 pKa = 10.49RR35 pKa = 11.84RR36 pKa = 11.84LAIRR40 pKa = 11.84TPRR43 pKa = 11.84EE44 pKa = 3.5GAEE47 pKa = 3.61PDD49 pKa = 2.95IVRR52 pKa = 11.84FYY54 pKa = 11.51LAFQKK59 pKa = 11.01DD60 pKa = 3.43LVARR64 pKa = 11.84GFPFFATEE72 pKa = 3.97FLRR75 pKa = 11.84GRR77 pKa = 11.84DD78 pKa = 3.62RR79 pKa = 11.84QQALYY84 pKa = 10.68NAGNSKK90 pKa = 10.73AVFGRR95 pKa = 11.84SPHH98 pKa = 5.44NFGMAVDD105 pKa = 4.09IVHH108 pKa = 7.33CKK110 pKa = 10.3RR111 pKa = 11.84LWDD114 pKa = 4.38LKK116 pKa = 8.2PQEE119 pKa = 3.93WALIGLLGKK128 pKa = 9.8EE129 pKa = 4.28AARR132 pKa = 11.84KK133 pKa = 9.39QSIKK137 pKa = 10.45IEE139 pKa = 3.96WGGDD143 pKa = 2.46WFGRR147 pKa = 11.84GKK149 pKa = 10.56RR150 pKa = 11.84RR151 pKa = 11.84TSPGQVGWDD160 pKa = 3.49PAHH163 pKa = 7.09WEE165 pKa = 3.78LADD168 pKa = 3.21WAKK171 pKa = 10.59RR172 pKa = 11.84IRR174 pKa = 11.84GLL176 pKa = 3.91
Molecular weight: 19.81 kDa
Isoelectric point according different methods:
Peptides (in silico digests for buttom-up proteomics)
Below you can find in silico digests of the whole proteome with Trypsin, Chymotrypsin, Trypsin+LysC, LysN, ArgC proteases suitable for different mass spec machines.| Try ESI |
 |
|---|
| ChTry ESI |
 |
|---|
| ArgC ESI |
 |
|---|
| LysN ESI |
 |
|---|
| TryLysC ESI |
 |
|---|
| Try MALDI |
 |
|---|
| ChTry MALDI |
 |
|---|
| ArgC MALDI |
 |
|---|
| LysN MALDI |
 |
|---|
| TryLysC MALDI |
 |
|---|
| Try LTQ |
 |
|---|
| ChTry LTQ |
 |
|---|
| ArgC LTQ |
 |
|---|
| LysN LTQ |
 |
|---|
| TryLysC LTQ |
 |
|---|
| Try MSlow |
 |
|---|
| ChTry MSlow |
 |
|---|
| ArgC MSlow |
 |
|---|
| LysN MSlow |
 |
|---|
| TryLysC MSlow |
 |
|---|
| Try MShigh |
 |
|---|
| ChTry MShigh |
 |
|---|
| ArgC MShigh |
 |
|---|
| LysN MShigh |
 |
|---|
| TryLysC MShigh |
 |
|---|
General Statistics
Number of major isoforms |
Number of additional isoforms |
Number of all proteins |
Number of amino acids |
Min. Seq. Length |
Max. Seq. Length |
Avg. Seq. Length |
Avg. Mol. Weight |
|---|---|---|---|---|---|---|---|
0 |
1789 |
68 |
542 |
255.6 |
28.6 |
Amino acid frequency
Ala |
Cys |
Asp |
Glu |
Phe |
Gly |
His |
Ile |
Lys |
Leu |
|---|---|---|---|---|---|---|---|---|---|
8.496 ± 0.677 | 0.894 ± 0.419 |
6.26 ± 0.405 | 5.59 ± 0.512 |
3.969 ± 0.28 | 8.44 ± 1.057 |
2.124 ± 0.408 | 4.472 ± 0.527 |
4.863 ± 0.586 | 7.826 ± 0.36 |
Met |
Asn |
Gln |
Pro |
Arg |
Ser |
Thr |
Val |
Trp |
Tyr |
|---|---|---|---|---|---|---|---|---|---|
2.851 ± 0.468 | 3.801 ± 0.841 |
6.372 ± 0.657 | 3.913 ± 0.482 |
7.211 ± 0.577 | 4.975 ± 0.242 |
5.646 ± 0.582 | 6.875 ± 0.6 |
2.18 ± 0.407 | 3.242 ± 0.536 |
Most of the basic statistics you can see at this page can be downloaded from this CSV file
Proteome-pI is available under Creative Commons Attribution-NoDerivs license, for more details see here
| Reference: Kozlowski LP. Proteome-pI 2.0: Proteome Isoelectric Point Database Update. Nucleic Acids Res. 2021, doi: 10.1093/nar/gkab944 | Contact: Lukasz P. Kozlowski |
