Butyrivibrio fibrisolvens 16/4
Taxonomy: cellular organisms; Bacteria; Terrabacteria group; Firmicutes; Clostridia; Eubacteriales; Lachnospiraceae; Butyrivibrio; Butyrivibrio fibrisolvens
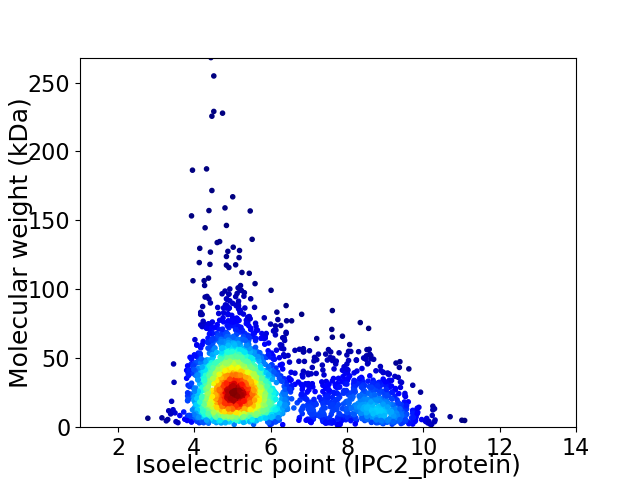
Average proteome isoelectric point is 5.8
Get precalculated fractions of proteins

Virtual 2D-PAGE plot for 2904 proteins (isoelectric point calculated using IPC2_protein)
Get csv file with sequences according to given criteria:
* You can choose from 21 different methods for calculating isoelectric point
Summary statistics related to proteome-wise predictions


Protein with the lowest isoelectric point:
>tr|D4IYZ5|D4IYZ5_BUTFI Serine/threonine protein phosphatase OS=Butyrivibrio fibrisolvens 16/4 OX=657324 GN=CIY_00990 PE=4 SV=1
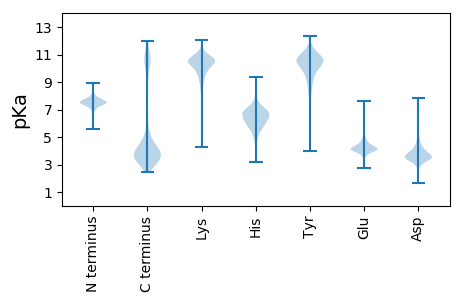
MM1 pKa = 7.49KK2 pKa = 10.43KK3 pKa = 10.23KK4 pKa = 10.39LLSVLLTGAMAASMFVGCGTSTEE27 pKa = 4.45TTDD30 pKa = 3.4NAAPAAEE37 pKa = 4.54GEE39 pKa = 4.47ATEE42 pKa = 4.44STTTAGGTKK51 pKa = 10.07VGVAMPTKK59 pKa = 10.47DD60 pKa = 3.5LQRR63 pKa = 11.84WNQDD67 pKa = 2.73GANMQKK73 pKa = 9.92EE74 pKa = 4.31LEE76 pKa = 4.18AAGYY80 pKa = 9.76EE81 pKa = 4.1VDD83 pKa = 5.01LQYY86 pKa = 11.69ASNDD90 pKa = 3.26TQTQVSQIEE99 pKa = 3.94NMINSGCNVLVVAAIEE115 pKa = 4.18ASSLGEE121 pKa = 4.21AMDD124 pKa = 3.85MAASANIPVIAYY136 pKa = 8.53DD137 pKa = 3.85RR138 pKa = 11.84LIMNTDD144 pKa = 2.95AVSYY148 pKa = 10.6YY149 pKa = 10.63ATFDD153 pKa = 3.26NYY155 pKa = 11.18KK156 pKa = 9.84VGTVQGQYY164 pKa = 10.43IIDD167 pKa = 3.77QLDD170 pKa = 3.59LEE172 pKa = 4.61NTDD175 pKa = 3.16KK176 pKa = 10.97TFTMEE181 pKa = 3.89ITAGDD186 pKa = 4.11PGDD189 pKa = 3.74NNAGFFYY196 pKa = 10.62NGAMDD201 pKa = 4.66LLKK204 pKa = 10.47PYY206 pKa = 9.74IEE208 pKa = 5.09KK209 pKa = 9.2GTIVVKK215 pKa = 10.64SGQTEE220 pKa = 4.19FQDD223 pKa = 3.49VATAAWATEE232 pKa = 4.23TAQSRR237 pKa = 11.84MEE239 pKa = 4.88NILSSYY245 pKa = 9.5YY246 pKa = 10.97ADD248 pKa = 3.83GTDD251 pKa = 6.16LDD253 pKa = 4.18ICLCSNDD260 pKa = 3.31STALGVEE267 pKa = 4.04NALAANYY274 pKa = 8.95NGKK277 pKa = 9.89YY278 pKa = 10.07PIVTGQDD285 pKa = 2.95CDD287 pKa = 3.59IEE289 pKa = 4.41NTKK292 pKa = 11.06NMIAGKK298 pKa = 10.19QSMSVFKK305 pKa = 9.92DD306 pKa = 3.03TRR308 pKa = 11.84TLASQVVKK316 pKa = 10.31MVGQILNGEE325 pKa = 4.21EE326 pKa = 3.89VDD328 pKa = 4.3VNDD331 pKa = 3.5TTTYY335 pKa = 11.16DD336 pKa = 3.56NNNGVVPSFLCDD348 pKa = 3.21PVFADD353 pKa = 3.2VNNYY357 pKa = 9.93KK358 pKa = 10.5EE359 pKa = 3.9ILIDD363 pKa = 3.33SGYY366 pKa = 8.45YY367 pKa = 9.62TEE369 pKa = 6.04DD370 pKa = 3.15QLQQ373 pKa = 3.2
MM1 pKa = 7.49KK2 pKa = 10.43KK3 pKa = 10.23KK4 pKa = 10.39LLSVLLTGAMAASMFVGCGTSTEE27 pKa = 4.45TTDD30 pKa = 3.4NAAPAAEE37 pKa = 4.54GEE39 pKa = 4.47ATEE42 pKa = 4.44STTTAGGTKK51 pKa = 10.07VGVAMPTKK59 pKa = 10.47DD60 pKa = 3.5LQRR63 pKa = 11.84WNQDD67 pKa = 2.73GANMQKK73 pKa = 9.92EE74 pKa = 4.31LEE76 pKa = 4.18AAGYY80 pKa = 9.76EE81 pKa = 4.1VDD83 pKa = 5.01LQYY86 pKa = 11.69ASNDD90 pKa = 3.26TQTQVSQIEE99 pKa = 3.94NMINSGCNVLVVAAIEE115 pKa = 4.18ASSLGEE121 pKa = 4.21AMDD124 pKa = 3.85MAASANIPVIAYY136 pKa = 8.53DD137 pKa = 3.85RR138 pKa = 11.84LIMNTDD144 pKa = 2.95AVSYY148 pKa = 10.6YY149 pKa = 10.63ATFDD153 pKa = 3.26NYY155 pKa = 11.18KK156 pKa = 9.84VGTVQGQYY164 pKa = 10.43IIDD167 pKa = 3.77QLDD170 pKa = 3.59LEE172 pKa = 4.61NTDD175 pKa = 3.16KK176 pKa = 10.97TFTMEE181 pKa = 3.89ITAGDD186 pKa = 4.11PGDD189 pKa = 3.74NNAGFFYY196 pKa = 10.62NGAMDD201 pKa = 4.66LLKK204 pKa = 10.47PYY206 pKa = 9.74IEE208 pKa = 5.09KK209 pKa = 9.2GTIVVKK215 pKa = 10.64SGQTEE220 pKa = 4.19FQDD223 pKa = 3.49VATAAWATEE232 pKa = 4.23TAQSRR237 pKa = 11.84MEE239 pKa = 4.88NILSSYY245 pKa = 9.5YY246 pKa = 10.97ADD248 pKa = 3.83GTDD251 pKa = 6.16LDD253 pKa = 4.18ICLCSNDD260 pKa = 3.31STALGVEE267 pKa = 4.04NALAANYY274 pKa = 8.95NGKK277 pKa = 9.89YY278 pKa = 10.07PIVTGQDD285 pKa = 2.95CDD287 pKa = 3.59IEE289 pKa = 4.41NTKK292 pKa = 11.06NMIAGKK298 pKa = 10.19QSMSVFKK305 pKa = 9.92DD306 pKa = 3.03TRR308 pKa = 11.84TLASQVVKK316 pKa = 10.31MVGQILNGEE325 pKa = 4.21EE326 pKa = 3.89VDD328 pKa = 4.3VNDD331 pKa = 3.5TTTYY335 pKa = 11.16DD336 pKa = 3.56NNNGVVPSFLCDD348 pKa = 3.21PVFADD353 pKa = 3.2VNNYY357 pKa = 9.93KK358 pKa = 10.5EE359 pKa = 3.9ILIDD363 pKa = 3.33SGYY366 pKa = 8.45YY367 pKa = 9.62TEE369 pKa = 6.04DD370 pKa = 3.15QLQQ373 pKa = 3.2
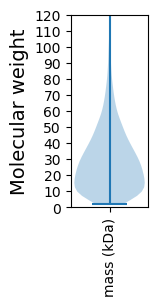
Molecular weight: 40.12 kDa
Isoelectric point according different methods:
Protein with the highest isoelectric point:
>tr|D4IYT5|D4IYT5_BUTFI Xylose-binding protein OS=Butyrivibrio fibrisolvens 16/4 OX=657324 GN=CIY_00260 PE=4 SV=1
MM1 pKa = 7.47VGVNGLGNMLNRR13 pKa = 11.84YY14 pKa = 6.38GTTVQKK20 pKa = 10.66LKK22 pKa = 10.51RR23 pKa = 11.84RR24 pKa = 11.84RR25 pKa = 11.84RR26 pKa = 11.84LQIQRR31 pKa = 11.84RR32 pKa = 11.84LQRR35 pKa = 11.84LLKK38 pKa = 10.42RR39 pKa = 11.84RR40 pKa = 3.66
MM1 pKa = 7.47VGVNGLGNMLNRR13 pKa = 11.84YY14 pKa = 6.38GTTVQKK20 pKa = 10.66LKK22 pKa = 10.51RR23 pKa = 11.84RR24 pKa = 11.84RR25 pKa = 11.84RR26 pKa = 11.84LQIQRR31 pKa = 11.84RR32 pKa = 11.84LQRR35 pKa = 11.84LLKK38 pKa = 10.42RR39 pKa = 11.84RR40 pKa = 3.66
Molecular weight: 4.88 kDa
Isoelectric point according different methods:
Peptides (in silico digests for buttom-up proteomics)
Below you can find in silico digests of the whole proteome with Trypsin, Chymotrypsin, Trypsin+LysC, LysN, ArgC proteases suitable for different mass spec machines.| Try ESI |
 |
|---|
| ChTry ESI |
 |
|---|
| ArgC ESI |
 |
|---|
| LysN ESI |
 |
|---|
| TryLysC ESI |
 |
|---|
| Try MALDI |
 |
|---|
| ChTry MALDI |
 |
|---|
| ArgC MALDI |
 |
|---|
| LysN MALDI |
 |
|---|
| TryLysC MALDI |
 |
|---|
| Try LTQ |
 |
|---|
| ChTry LTQ |
 |
|---|
| ArgC LTQ |
 |
|---|
| LysN LTQ |
 |
|---|
| TryLysC LTQ |
 |
|---|
| Try MSlow |
 |
|---|
| ChTry MSlow |
 |
|---|
| ArgC MSlow |
 |
|---|
| LysN MSlow |
 |
|---|
| TryLysC MSlow |
 |
|---|
| Try MShigh |
 |
|---|
| ChTry MShigh |
 |
|---|
| ArgC MShigh |
 |
|---|
| LysN MShigh |
 |
|---|
| TryLysC MShigh |
 |
|---|
General Statistics
Number of major isoforms |
Number of additional isoforms |
Number of all proteins |
Number of amino acids |
Min. Seq. Length |
Max. Seq. Length |
Avg. Seq. Length |
Avg. Mol. Weight |
|---|---|---|---|---|---|---|---|
0 |
797346 |
15 |
2445 |
274.6 |
30.71 |
Amino acid frequency
Ala |
Cys |
Asp |
Glu |
Phe |
Gly |
His |
Ile |
Lys |
Leu |
|---|---|---|---|---|---|---|---|---|---|
7.494 ± 0.049 | 1.383 ± 0.021 |
6.386 ± 0.045 | 7.367 ± 0.053 |
4.211 ± 0.038 | 6.9 ± 0.044 |
1.611 ± 0.022 | 7.764 ± 0.049 |
6.97 ± 0.041 | 8.373 ± 0.056 |
Met |
Asn |
Gln |
Pro |
Arg |
Ser |
Thr |
Val |
Trp |
Tyr |
|---|---|---|---|---|---|---|---|---|---|
3.025 ± 0.029 | 5.055 ± 0.035 |
3.083 ± 0.029 | 2.817 ± 0.024 |
3.64 ± 0.033 | 6.128 ± 0.083 |
5.546 ± 0.047 | 7.083 ± 0.04 |
0.874 ± 0.018 | 4.289 ± 0.038 |
Most of the basic statistics you can see at this page can be downloaded from this CSV file
Proteome-pI is available under Creative Commons Attribution-NoDerivs license, for more details see here
| Reference: Kozlowski LP. Proteome-pI 2.0: Proteome Isoelectric Point Database Update. Nucleic Acids Res. 2021, doi: 10.1093/nar/gkab944 | Contact: Lukasz P. Kozlowski |
