Agathobaculum butyriciproducens
Taxonomy: cellular organisms; Bacteria; Terrabacteria group; Firmicutes; Clostridia; Eubacteriales; Oscillospiraceae; Agathobaculum
Average proteome isoelectric point is 6.19
Get precalculated fractions of proteins

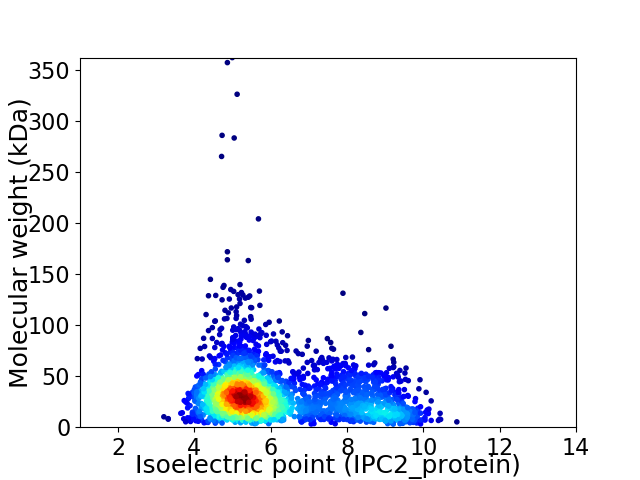
Virtual 2D-PAGE plot for 2545 proteins (isoelectric point calculated using IPC2_protein)
Get csv file with sequences according to given criteria:
* You can choose from 21 different methods for calculating isoelectric point
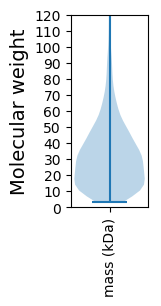
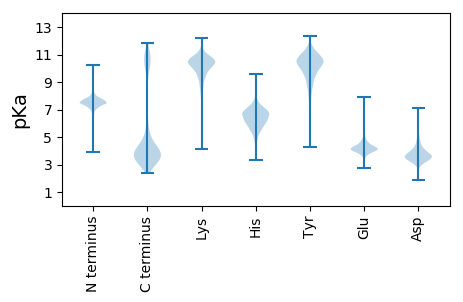
Summary statistics related to proteome-wise predictions


Protein with the lowest isoelectric point:
>tr|A0A2U1BFX9|A0A2U1BFX9_9FIRM Uncharacterized protein OS=Agathobaculum butyriciproducens OX=1628085 GN=C7386_102158 PE=4 SV=1
MM1 pKa = 7.69EE2 pKa = 4.72EE3 pKa = 3.69MRR5 pKa = 11.84VYY7 pKa = 10.25IANLGKK13 pKa = 10.45YY14 pKa = 9.93NEE16 pKa = 4.62GEE18 pKa = 3.95LVGAWFEE25 pKa = 4.02PPIDD29 pKa = 3.75FDD31 pKa = 4.02EE32 pKa = 4.56VKK34 pKa = 10.65EE35 pKa = 4.16RR36 pKa = 11.84IGLNDD41 pKa = 3.13QYY43 pKa = 11.4EE44 pKa = 4.64EE45 pKa = 4.17YY46 pKa = 10.37AIHH49 pKa = 7.48DD50 pKa = 3.8FEE52 pKa = 5.92LPFEE56 pKa = 4.4IEE58 pKa = 4.13EE59 pKa = 4.01YY60 pKa = 10.75TPIEE64 pKa = 4.52EE65 pKa = 4.21INRR68 pKa = 11.84LCEE71 pKa = 3.99MVEE74 pKa = 4.25DD75 pKa = 4.12LPDD78 pKa = 3.88YY79 pKa = 10.97IRR81 pKa = 11.84DD82 pKa = 3.71NMGSLLSYY90 pKa = 10.6YY91 pKa = 10.67SGVEE95 pKa = 4.12DD96 pKa = 4.1FCEE99 pKa = 4.01HH100 pKa = 7.14ADD102 pKa = 6.15DD103 pKa = 5.28IILWSGCDD111 pKa = 3.15TTADD115 pKa = 3.43VAEE118 pKa = 4.06QMLDD122 pKa = 2.98EE123 pKa = 4.79GLISDD128 pKa = 3.87EE129 pKa = 3.88TLRR132 pKa = 11.84RR133 pKa = 11.84YY134 pKa = 9.7FDD136 pKa = 3.38SVQYY140 pKa = 11.03GRR142 pKa = 11.84DD143 pKa = 3.15LSMEE147 pKa = 4.11GDD149 pKa = 3.76FVEE152 pKa = 4.68TKK154 pKa = 10.74DD155 pKa = 4.43GVFEE159 pKa = 5.36LIRR162 pKa = 5.25
MM1 pKa = 7.69EE2 pKa = 4.72EE3 pKa = 3.69MRR5 pKa = 11.84VYY7 pKa = 10.25IANLGKK13 pKa = 10.45YY14 pKa = 9.93NEE16 pKa = 4.62GEE18 pKa = 3.95LVGAWFEE25 pKa = 4.02PPIDD29 pKa = 3.75FDD31 pKa = 4.02EE32 pKa = 4.56VKK34 pKa = 10.65EE35 pKa = 4.16RR36 pKa = 11.84IGLNDD41 pKa = 3.13QYY43 pKa = 11.4EE44 pKa = 4.64EE45 pKa = 4.17YY46 pKa = 10.37AIHH49 pKa = 7.48DD50 pKa = 3.8FEE52 pKa = 5.92LPFEE56 pKa = 4.4IEE58 pKa = 4.13EE59 pKa = 4.01YY60 pKa = 10.75TPIEE64 pKa = 4.52EE65 pKa = 4.21INRR68 pKa = 11.84LCEE71 pKa = 3.99MVEE74 pKa = 4.25DD75 pKa = 4.12LPDD78 pKa = 3.88YY79 pKa = 10.97IRR81 pKa = 11.84DD82 pKa = 3.71NMGSLLSYY90 pKa = 10.6YY91 pKa = 10.67SGVEE95 pKa = 4.12DD96 pKa = 4.1FCEE99 pKa = 4.01HH100 pKa = 7.14ADD102 pKa = 6.15DD103 pKa = 5.28IILWSGCDD111 pKa = 3.15TTADD115 pKa = 3.43VAEE118 pKa = 4.06QMLDD122 pKa = 2.98EE123 pKa = 4.79GLISDD128 pKa = 3.87EE129 pKa = 3.88TLRR132 pKa = 11.84RR133 pKa = 11.84YY134 pKa = 9.7FDD136 pKa = 3.38SVQYY140 pKa = 11.03GRR142 pKa = 11.84DD143 pKa = 3.15LSMEE147 pKa = 4.11GDD149 pKa = 3.76FVEE152 pKa = 4.68TKK154 pKa = 10.74DD155 pKa = 4.43GVFEE159 pKa = 5.36LIRR162 pKa = 5.25
Molecular weight: 18.95 kDa
Isoelectric point according different methods:
Protein with the highest isoelectric point:
>tr|A0A2U1BDR0|A0A2U1BDR0_9FIRM Ribonuclease H OS=Agathobaculum butyriciproducens OX=1628085 GN=rnhA PE=3 SV=1
MM1 pKa = 7.45KK2 pKa = 9.6RR3 pKa = 11.84TFQPKK8 pKa = 8.85KK9 pKa = 7.62RR10 pKa = 11.84QRR12 pKa = 11.84SKK14 pKa = 9.69EE15 pKa = 3.5HH16 pKa = 6.14GFRR19 pKa = 11.84KK20 pKa = 9.99RR21 pKa = 11.84MSTSNGRR28 pKa = 11.84KK29 pKa = 8.23VLARR33 pKa = 11.84RR34 pKa = 11.84RR35 pKa = 11.84AKK37 pKa = 10.49GRR39 pKa = 11.84AKK41 pKa = 10.69LSAA44 pKa = 3.92
MM1 pKa = 7.45KK2 pKa = 9.6RR3 pKa = 11.84TFQPKK8 pKa = 8.85KK9 pKa = 7.62RR10 pKa = 11.84QRR12 pKa = 11.84SKK14 pKa = 9.69EE15 pKa = 3.5HH16 pKa = 6.14GFRR19 pKa = 11.84KK20 pKa = 9.99RR21 pKa = 11.84MSTSNGRR28 pKa = 11.84KK29 pKa = 8.23VLARR33 pKa = 11.84RR34 pKa = 11.84RR35 pKa = 11.84AKK37 pKa = 10.49GRR39 pKa = 11.84AKK41 pKa = 10.69LSAA44 pKa = 3.92
Molecular weight: 5.23 kDa
Isoelectric point according different methods:
Peptides (in silico digests for buttom-up proteomics)
Below you can find in silico digests of the whole proteome with Trypsin, Chymotrypsin, Trypsin+LysC, LysN, ArgC proteases suitable for different mass spec machines.| Try ESI |
 |
|---|
| ChTry ESI |
 |
|---|
| ArgC ESI |
 |
|---|
| LysN ESI |
 |
|---|
| TryLysC ESI |
 |
|---|
| Try MALDI |
 |
|---|
| ChTry MALDI |
 |
|---|
| ArgC MALDI |
 |
|---|
| LysN MALDI |
 |
|---|
| TryLysC MALDI |
 |
|---|
| Try LTQ |
 |
|---|
| ChTry LTQ |
 |
|---|
| ArgC LTQ |
 |
|---|
| LysN LTQ |
 |
|---|
| TryLysC LTQ |
 |
|---|
| Try MSlow |
 |
|---|
| ChTry MSlow |
 |
|---|
| ArgC MSlow |
 |
|---|
| LysN MSlow |
 |
|---|
| TryLysC MSlow |
 |
|---|
| Try MShigh |
 |
|---|
| ChTry MShigh |
 |
|---|
| ArgC MShigh |
 |
|---|
| LysN MShigh |
 |
|---|
| TryLysC MShigh |
 |
|---|
General Statistics
Number of major isoforms |
Number of additional isoforms |
Number of all proteins |
Number of amino acids |
Min. Seq. Length |
Max. Seq. Length |
Avg. Seq. Length |
Avg. Mol. Weight |
|---|---|---|---|---|---|---|---|
0 |
787198 |
27 |
3344 |
309.3 |
34.22 |
Amino acid frequency
Ala |
Cys |
Asp |
Glu |
Phe |
Gly |
His |
Ile |
Lys |
Leu |
|---|---|---|---|---|---|---|---|---|---|
9.542 ± 0.054 | 1.632 ± 0.02 |
5.854 ± 0.041 | 6.63 ± 0.053 |
3.817 ± 0.036 | 7.427 ± 0.052 |
1.986 ± 0.028 | 6.071 ± 0.045 |
5.442 ± 0.042 | 9.252 ± 0.066 |
Met |
Asn |
Gln |
Pro |
Arg |
Ser |
Thr |
Val |
Trp |
Tyr |
|---|---|---|---|---|---|---|---|---|---|
2.901 ± 0.025 | 3.741 ± 0.039 |
3.818 ± 0.028 | 3.491 ± 0.033 |
5.332 ± 0.055 | 5.612 ± 0.041 |
5.993 ± 0.061 | 7.031 ± 0.047 |
0.903 ± 0.015 | 3.522 ± 0.033 |
Most of the basic statistics you can see at this page can be downloaded from this CSV file
Proteome-pI is available under Creative Commons Attribution-NoDerivs license, for more details see here
| Reference: Kozlowski LP. Proteome-pI 2.0: Proteome Isoelectric Point Database Update. Nucleic Acids Res. 2021, doi: 10.1093/nar/gkab944 | Contact: Lukasz P. Kozlowski |
