Hypericibacter adhaerens
Taxonomy: cellular organisms; Bacteria; Proteobacteria; Alphaproteobacteria; Rhodospirillales; Rhodospirillaceae; Hypericibacter
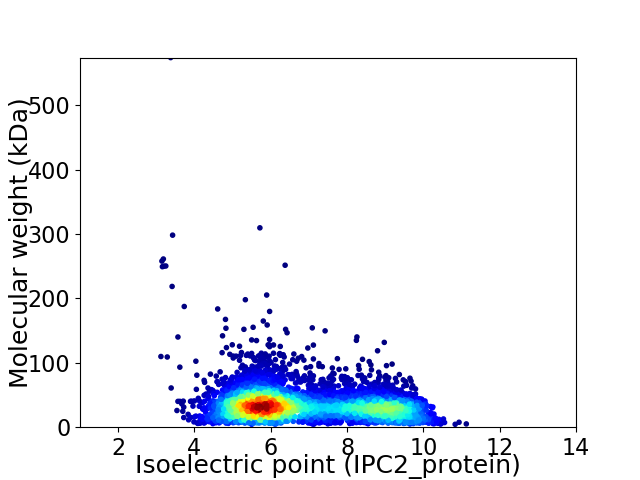
Average proteome isoelectric point is 6.83
Get precalculated fractions of proteins

Virtual 2D-PAGE plot for 5227 proteins (isoelectric point calculated using IPC2_protein)
Get csv file with sequences according to given criteria:
* You can choose from 21 different methods for calculating isoelectric point
Summary statistics related to proteome-wise predictions


Protein with the lowest isoelectric point:
>tr|A0A5J6N5H7|A0A5J6N5H7_9PROT Uncharacterized protein OS=Hypericibacter adhaerens OX=2602016 GN=FRZ61_51170 PE=4 SV=1
MM1 pKa = 7.51KK2 pKa = 10.41NVLLGTTALVAAGLVASHH20 pKa = 6.95AEE22 pKa = 3.87AAQGVQLGIGGYY34 pKa = 8.36YY35 pKa = 9.87AAAAGLLFDD44 pKa = 4.7QSDD47 pKa = 4.19GNGDD51 pKa = 3.97PGDD54 pKa = 3.73HH55 pKa = 6.43TRR57 pKa = 11.84DD58 pKa = 2.91IVFRR62 pKa = 11.84QDD64 pKa = 3.1VEE66 pKa = 4.0IHH68 pKa = 6.19FKK70 pKa = 11.55GEE72 pKa = 3.95TTLDD76 pKa = 3.17NGLTVGARR84 pKa = 11.84VEE86 pKa = 4.93LEE88 pKa = 4.18GQQSTDD94 pKa = 3.34QIDD97 pKa = 3.88EE98 pKa = 3.7VWAYY102 pKa = 10.17FKK104 pKa = 11.24GGWGEE109 pKa = 4.17LRR111 pKa = 11.84FGDD114 pKa = 5.18DD115 pKa = 5.06DD116 pKa = 5.33DD117 pKa = 4.43ATEE120 pKa = 3.79QLGYY124 pKa = 10.28IIPSASNIFGVDD136 pKa = 3.03TPYY139 pKa = 11.11FEE141 pKa = 5.15FANNHH146 pKa = 5.37GGFTNGVFQTNSTLMDD162 pKa = 3.56ISSDD166 pKa = 3.17ATKK169 pKa = 10.11IIYY172 pKa = 8.86FSPTFAGFSFAASFAPDD189 pKa = 3.05RR190 pKa = 11.84RR191 pKa = 11.84GEE193 pKa = 3.98DD194 pKa = 3.33TYY196 pKa = 11.46SYY198 pKa = 10.42WSGPGGTTNSNNTGQVQNVFAAALNFDD225 pKa = 3.77HH226 pKa = 7.57DD227 pKa = 4.57FNGVSLATGVGFAEE241 pKa = 4.89GQWEE245 pKa = 4.61TKK247 pKa = 10.72ASGANVDD254 pKa = 4.01TTWGVNGHH262 pKa = 6.98LDD264 pKa = 3.37VSFSGFTIGGSGMYY278 pKa = 9.51RR279 pKa = 11.84DD280 pKa = 4.23NWQSSAGTDD289 pKa = 3.27YY290 pKa = 10.47WVAGIGATYY299 pKa = 10.63NWDD302 pKa = 2.79AWTVGLAWSHH312 pKa = 6.14GDD314 pKa = 3.7YY315 pKa = 10.67EE316 pKa = 4.57YY317 pKa = 11.04TPSNDD322 pKa = 3.46DD323 pKa = 3.57DD324 pKa = 6.17KK325 pKa = 11.68IDD327 pKa = 3.32IVEE330 pKa = 4.08FTGRR334 pKa = 11.84YY335 pKa = 9.5DD336 pKa = 3.99LGPGISLDD344 pKa = 3.73GMVGYY349 pKa = 11.24NDD351 pKa = 3.79MNAGDD356 pKa = 4.66TGHH359 pKa = 6.67QDD361 pKa = 3.42DD362 pKa = 4.9KK363 pKa = 10.76TWEE366 pKa = 4.3AGVGFYY372 pKa = 10.23IGFF375 pKa = 3.99
MM1 pKa = 7.51KK2 pKa = 10.41NVLLGTTALVAAGLVASHH20 pKa = 6.95AEE22 pKa = 3.87AAQGVQLGIGGYY34 pKa = 8.36YY35 pKa = 9.87AAAAGLLFDD44 pKa = 4.7QSDD47 pKa = 4.19GNGDD51 pKa = 3.97PGDD54 pKa = 3.73HH55 pKa = 6.43TRR57 pKa = 11.84DD58 pKa = 2.91IVFRR62 pKa = 11.84QDD64 pKa = 3.1VEE66 pKa = 4.0IHH68 pKa = 6.19FKK70 pKa = 11.55GEE72 pKa = 3.95TTLDD76 pKa = 3.17NGLTVGARR84 pKa = 11.84VEE86 pKa = 4.93LEE88 pKa = 4.18GQQSTDD94 pKa = 3.34QIDD97 pKa = 3.88EE98 pKa = 3.7VWAYY102 pKa = 10.17FKK104 pKa = 11.24GGWGEE109 pKa = 4.17LRR111 pKa = 11.84FGDD114 pKa = 5.18DD115 pKa = 5.06DD116 pKa = 5.33DD117 pKa = 4.43ATEE120 pKa = 3.79QLGYY124 pKa = 10.28IIPSASNIFGVDD136 pKa = 3.03TPYY139 pKa = 11.11FEE141 pKa = 5.15FANNHH146 pKa = 5.37GGFTNGVFQTNSTLMDD162 pKa = 3.56ISSDD166 pKa = 3.17ATKK169 pKa = 10.11IIYY172 pKa = 8.86FSPTFAGFSFAASFAPDD189 pKa = 3.05RR190 pKa = 11.84RR191 pKa = 11.84GEE193 pKa = 3.98DD194 pKa = 3.33TYY196 pKa = 11.46SYY198 pKa = 10.42WSGPGGTTNSNNTGQVQNVFAAALNFDD225 pKa = 3.77HH226 pKa = 7.57DD227 pKa = 4.57FNGVSLATGVGFAEE241 pKa = 4.89GQWEE245 pKa = 4.61TKK247 pKa = 10.72ASGANVDD254 pKa = 4.01TTWGVNGHH262 pKa = 6.98LDD264 pKa = 3.37VSFSGFTIGGSGMYY278 pKa = 9.51RR279 pKa = 11.84DD280 pKa = 4.23NWQSSAGTDD289 pKa = 3.27YY290 pKa = 10.47WVAGIGATYY299 pKa = 10.63NWDD302 pKa = 2.79AWTVGLAWSHH312 pKa = 6.14GDD314 pKa = 3.7YY315 pKa = 10.67EE316 pKa = 4.57YY317 pKa = 11.04TPSNDD322 pKa = 3.46DD323 pKa = 3.57DD324 pKa = 6.17KK325 pKa = 11.68IDD327 pKa = 3.32IVEE330 pKa = 4.08FTGRR334 pKa = 11.84YY335 pKa = 9.5DD336 pKa = 3.99LGPGISLDD344 pKa = 3.73GMVGYY349 pKa = 11.24NDD351 pKa = 3.79MNAGDD356 pKa = 4.66TGHH359 pKa = 6.67QDD361 pKa = 3.42DD362 pKa = 4.9KK363 pKa = 10.76TWEE366 pKa = 4.3AGVGFYY372 pKa = 10.23IGFF375 pKa = 3.99
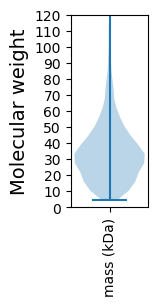
Molecular weight: 40.15 kDa
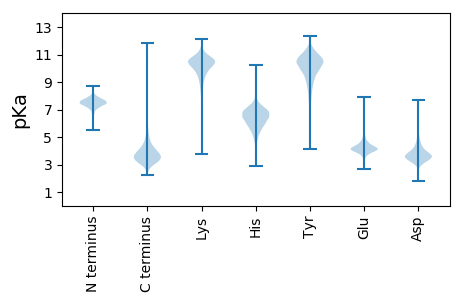
Isoelectric point according different methods:
Protein with the highest isoelectric point:
>tr|A0A5J6MTN6|A0A5J6MTN6_9PROT Polyphosphate kinase OS=Hypericibacter adhaerens OX=2602016 GN=FRZ61_06080 PE=3 SV=1
MM1 pKa = 7.35KK2 pKa = 9.36RR3 pKa = 11.84TYY5 pKa = 10.1QPSVLVRR12 pKa = 11.84KK13 pKa = 9.31RR14 pKa = 11.84RR15 pKa = 11.84HH16 pKa = 4.43GFRR19 pKa = 11.84ARR21 pKa = 11.84MATVGGRR28 pKa = 11.84KK29 pKa = 9.34VIASRR34 pKa = 11.84RR35 pKa = 11.84AKK37 pKa = 9.73GRR39 pKa = 11.84KK40 pKa = 8.92RR41 pKa = 11.84LSAA44 pKa = 3.96
MM1 pKa = 7.35KK2 pKa = 9.36RR3 pKa = 11.84TYY5 pKa = 10.1QPSVLVRR12 pKa = 11.84KK13 pKa = 9.31RR14 pKa = 11.84RR15 pKa = 11.84HH16 pKa = 4.43GFRR19 pKa = 11.84ARR21 pKa = 11.84MATVGGRR28 pKa = 11.84KK29 pKa = 9.34VIASRR34 pKa = 11.84RR35 pKa = 11.84AKK37 pKa = 9.73GRR39 pKa = 11.84KK40 pKa = 8.92RR41 pKa = 11.84LSAA44 pKa = 3.96
Molecular weight: 5.1 kDa
Isoelectric point according different methods:
Peptides (in silico digests for buttom-up proteomics)
Below you can find in silico digests of the whole proteome with Trypsin, Chymotrypsin, Trypsin+LysC, LysN, ArgC proteases suitable for different mass spec machines.| Try ESI |
 |
|---|
| ChTry ESI |
 |
|---|
| ArgC ESI |
 |
|---|
| LysN ESI |
 |
|---|
| TryLysC ESI |
 |
|---|
| Try MALDI |
 |
|---|
| ChTry MALDI |
 |
|---|
| ArgC MALDI |
 |
|---|
| LysN MALDI |
 |
|---|
| TryLysC MALDI |
 |
|---|
| Try LTQ |
 |
|---|
| ChTry LTQ |
 |
|---|
| ArgC LTQ |
 |
|---|
| LysN LTQ |
 |
|---|
| TryLysC LTQ |
 |
|---|
| Try MSlow |
 |
|---|
| ChTry MSlow |
 |
|---|
| ArgC MSlow |
 |
|---|
| LysN MSlow |
 |
|---|
| TryLysC MSlow |
 |
|---|
| Try MShigh |
 |
|---|
| ChTry MShigh |
 |
|---|
| ArgC MShigh |
 |
|---|
| LysN MShigh |
 |
|---|
| TryLysC MShigh |
 |
|---|
General Statistics
Number of major isoforms |
Number of additional isoforms |
Number of all proteins |
Number of amino acids |
Min. Seq. Length |
Max. Seq. Length |
Avg. Seq. Length |
Avg. Mol. Weight |
|---|---|---|---|---|---|---|---|
0 |
1721620 |
39 |
5653 |
329.4 |
35.71 |
Amino acid frequency
Ala |
Cys |
Asp |
Glu |
Phe |
Gly |
His |
Ile |
Lys |
Leu |
|---|---|---|---|---|---|---|---|---|---|
12.745 ± 0.057 | 0.869 ± 0.01 |
5.508 ± 0.056 | 5.638 ± 0.034 |
3.556 ± 0.018 | 8.957 ± 0.061 |
2.073 ± 0.017 | 5.077 ± 0.025 |
3.217 ± 0.028 | 10.656 ± 0.052 |
Met |
Asn |
Gln |
Pro |
Arg |
Ser |
Thr |
Val |
Trp |
Tyr |
|---|---|---|---|---|---|---|---|---|---|
2.319 ± 0.016 | 2.435 ± 0.029 |
5.515 ± 0.032 | 3.177 ± 0.02 |
7.385 ± 0.049 | 5.059 ± 0.027 |
5.042 ± 0.055 | 7.038 ± 0.03 |
1.436 ± 0.014 | 2.299 ± 0.019 |
Most of the basic statistics you can see at this page can be downloaded from this CSV file
Proteome-pI is available under Creative Commons Attribution-NoDerivs license, for more details see here
| Reference: Kozlowski LP. Proteome-pI 2.0: Proteome Isoelectric Point Database Update. Nucleic Acids Res. 2021, doi: 10.1093/nar/gkab944 | Contact: Lukasz P. Kozlowski |
