Microbacterium sp. Root180
Taxonomy: cellular organisms; Bacteria; Terrabacteria group; Actinobacteria; Actinomycetia; Micrococcales; Microbacteriaceae; Microbacterium; unclassified Microbacterium
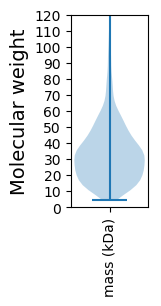
Average proteome isoelectric point is 5.87
Get precalculated fractions of proteins

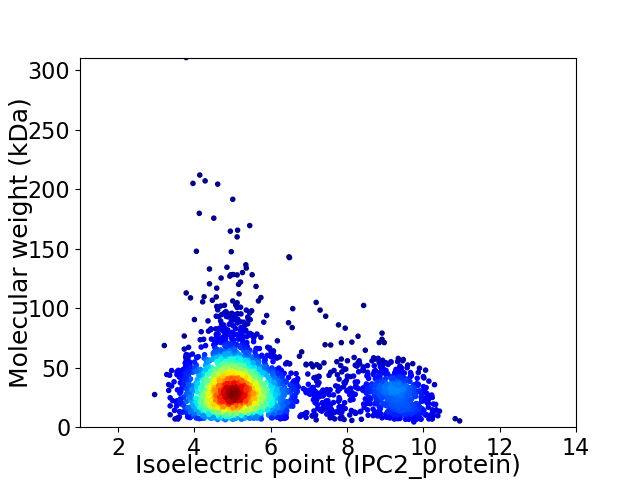
Virtual 2D-PAGE plot for 3036 proteins (isoelectric point calculated using IPC2_protein)
Get csv file with sequences according to given criteria:
* You can choose from 21 different methods for calculating isoelectric point
Summary statistics related to proteome-wise predictions


Protein with the lowest isoelectric point:
>tr|A0A0Q8LNY5|A0A0Q8LNY5_9MICO Elongation factor Tu OS=Microbacterium sp. Root180 OX=1736483 GN=tuf PE=3 SV=1
MM1 pKa = 7.39LAASALALVACAGPSVPPDD20 pKa = 3.14VDD22 pKa = 4.37FDD24 pKa = 4.47DD25 pKa = 5.14PLPGAALAAAVDD37 pKa = 4.12DD38 pKa = 4.27AVTAVGVSDD47 pKa = 3.72GDD49 pKa = 3.68LWPSCWSDD57 pKa = 4.42DD58 pKa = 4.12DD59 pKa = 4.9ALYY62 pKa = 10.64AANGDD67 pKa = 3.64GAGFGNEE74 pKa = 3.92FFDD77 pKa = 3.86IAVNRR82 pKa = 11.84ITGSPTAEE90 pKa = 4.63DD91 pKa = 3.74GLEE94 pKa = 4.13GEE96 pKa = 4.72VLAGGDD102 pKa = 4.18AIGQVWSGEE111 pKa = 3.95GFTRR115 pKa = 11.84KK116 pKa = 7.75PTGMLCTGGSLYY128 pKa = 10.93LAVQDD133 pKa = 5.01LRR135 pKa = 11.84LDD137 pKa = 3.78FNEE140 pKa = 4.7APAATIARR148 pKa = 11.84SDD150 pKa = 3.53DD151 pKa = 4.41HH152 pKa = 6.61GATWTWDD159 pKa = 3.09TSAPMFDD166 pKa = 4.46DD167 pKa = 5.44GVFTTVWFADD177 pKa = 3.54YY178 pKa = 10.77GKK180 pKa = 9.96EE181 pKa = 4.26GEE183 pKa = 4.49HH184 pKa = 6.95APDD187 pKa = 4.03PGYY190 pKa = 11.18AYY192 pKa = 10.31AYY194 pKa = 10.15GLDD197 pKa = 3.99GNWRR201 pKa = 11.84DD202 pKa = 4.13SFDD205 pKa = 5.09DD206 pKa = 3.75SAPDD210 pKa = 3.55PTEE213 pKa = 4.23LFLARR218 pKa = 11.84VPVDD222 pKa = 3.72SVQDD226 pKa = 3.4ASTWEE231 pKa = 4.74FYY233 pKa = 10.94AGEE236 pKa = 4.58PGDD239 pKa = 6.0AEE241 pKa = 4.37PTWTGDD247 pKa = 2.85ISAKK251 pKa = 10.38RR252 pKa = 11.84PVLVDD257 pKa = 3.21EE258 pKa = 4.88RR259 pKa = 11.84VVHH262 pKa = 6.48PGDD265 pKa = 3.56GAGEE269 pKa = 4.49DD270 pKa = 4.13GQTVGAQNLTVISQGGVTYY289 pKa = 10.53LPKK292 pKa = 10.15LDD294 pKa = 3.68RR295 pKa = 11.84YY296 pKa = 10.97VYY298 pKa = 9.7TSWTEE303 pKa = 3.73LTFEE307 pKa = 4.9FYY309 pKa = 10.64EE310 pKa = 5.07SPTPWGPWTLFLSEE324 pKa = 5.46DD325 pKa = 3.68FGPYY329 pKa = 9.29PWTDD333 pKa = 3.04EE334 pKa = 4.22RR335 pKa = 11.84FGGYY339 pKa = 7.8GTTIPSKK346 pKa = 10.55FLSDD350 pKa = 4.47DD351 pKa = 3.58NRR353 pKa = 11.84SMWVQSNVCPCAPAGMSSYY372 pKa = 10.45WFGLRR377 pKa = 11.84PLYY380 pKa = 9.77LAPVDD385 pKa = 3.7
MM1 pKa = 7.39LAASALALVACAGPSVPPDD20 pKa = 3.14VDD22 pKa = 4.37FDD24 pKa = 4.47DD25 pKa = 5.14PLPGAALAAAVDD37 pKa = 4.12DD38 pKa = 4.27AVTAVGVSDD47 pKa = 3.72GDD49 pKa = 3.68LWPSCWSDD57 pKa = 4.42DD58 pKa = 4.12DD59 pKa = 4.9ALYY62 pKa = 10.64AANGDD67 pKa = 3.64GAGFGNEE74 pKa = 3.92FFDD77 pKa = 3.86IAVNRR82 pKa = 11.84ITGSPTAEE90 pKa = 4.63DD91 pKa = 3.74GLEE94 pKa = 4.13GEE96 pKa = 4.72VLAGGDD102 pKa = 4.18AIGQVWSGEE111 pKa = 3.95GFTRR115 pKa = 11.84KK116 pKa = 7.75PTGMLCTGGSLYY128 pKa = 10.93LAVQDD133 pKa = 5.01LRR135 pKa = 11.84LDD137 pKa = 3.78FNEE140 pKa = 4.7APAATIARR148 pKa = 11.84SDD150 pKa = 3.53DD151 pKa = 4.41HH152 pKa = 6.61GATWTWDD159 pKa = 3.09TSAPMFDD166 pKa = 4.46DD167 pKa = 5.44GVFTTVWFADD177 pKa = 3.54YY178 pKa = 10.77GKK180 pKa = 9.96EE181 pKa = 4.26GEE183 pKa = 4.49HH184 pKa = 6.95APDD187 pKa = 4.03PGYY190 pKa = 11.18AYY192 pKa = 10.31AYY194 pKa = 10.15GLDD197 pKa = 3.99GNWRR201 pKa = 11.84DD202 pKa = 4.13SFDD205 pKa = 5.09DD206 pKa = 3.75SAPDD210 pKa = 3.55PTEE213 pKa = 4.23LFLARR218 pKa = 11.84VPVDD222 pKa = 3.72SVQDD226 pKa = 3.4ASTWEE231 pKa = 4.74FYY233 pKa = 10.94AGEE236 pKa = 4.58PGDD239 pKa = 6.0AEE241 pKa = 4.37PTWTGDD247 pKa = 2.85ISAKK251 pKa = 10.38RR252 pKa = 11.84PVLVDD257 pKa = 3.21EE258 pKa = 4.88RR259 pKa = 11.84VVHH262 pKa = 6.48PGDD265 pKa = 3.56GAGEE269 pKa = 4.49DD270 pKa = 4.13GQTVGAQNLTVISQGGVTYY289 pKa = 10.53LPKK292 pKa = 10.15LDD294 pKa = 3.68RR295 pKa = 11.84YY296 pKa = 10.97VYY298 pKa = 9.7TSWTEE303 pKa = 3.73LTFEE307 pKa = 4.9FYY309 pKa = 10.64EE310 pKa = 5.07SPTPWGPWTLFLSEE324 pKa = 5.46DD325 pKa = 3.68FGPYY329 pKa = 9.29PWTDD333 pKa = 3.04EE334 pKa = 4.22RR335 pKa = 11.84FGGYY339 pKa = 7.8GTTIPSKK346 pKa = 10.55FLSDD350 pKa = 4.47DD351 pKa = 3.58NRR353 pKa = 11.84SMWVQSNVCPCAPAGMSSYY372 pKa = 10.45WFGLRR377 pKa = 11.84PLYY380 pKa = 9.77LAPVDD385 pKa = 3.7
Molecular weight: 41.22 kDa
Isoelectric point according different methods:
Protein with the highest isoelectric point:
>tr|A0A0Q8LKR9|A0A0Q8LKR9_9MICO Cytidyltransferase OS=Microbacterium sp. Root180 OX=1736483 GN=ASD93_14290 PE=4 SV=1
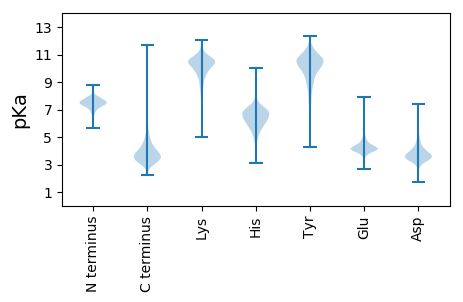
MM1 pKa = 7.51TKK3 pKa = 9.09RR4 pKa = 11.84TFQPNNRR11 pKa = 11.84RR12 pKa = 11.84RR13 pKa = 11.84AKK15 pKa = 10.04KK16 pKa = 8.86HH17 pKa = 4.36GFRR20 pKa = 11.84ARR22 pKa = 11.84MRR24 pKa = 11.84TRR26 pKa = 11.84AGRR29 pKa = 11.84AILSARR35 pKa = 11.84RR36 pKa = 11.84GKK38 pKa = 10.71GRR40 pKa = 11.84TEE42 pKa = 4.13LSAA45 pKa = 4.86
MM1 pKa = 7.51TKK3 pKa = 9.09RR4 pKa = 11.84TFQPNNRR11 pKa = 11.84RR12 pKa = 11.84RR13 pKa = 11.84AKK15 pKa = 10.04KK16 pKa = 8.86HH17 pKa = 4.36GFRR20 pKa = 11.84ARR22 pKa = 11.84MRR24 pKa = 11.84TRR26 pKa = 11.84AGRR29 pKa = 11.84AILSARR35 pKa = 11.84RR36 pKa = 11.84GKK38 pKa = 10.71GRR40 pKa = 11.84TEE42 pKa = 4.13LSAA45 pKa = 4.86
Molecular weight: 5.25 kDa
Isoelectric point according different methods:
Peptides (in silico digests for buttom-up proteomics)
Below you can find in silico digests of the whole proteome with Trypsin, Chymotrypsin, Trypsin+LysC, LysN, ArgC proteases suitable for different mass spec machines.| Try ESI |
 |
|---|
| ChTry ESI |
 |
|---|
| ArgC ESI |
 |
|---|
| LysN ESI |
 |
|---|
| TryLysC ESI |
 |
|---|
| Try MALDI |
 |
|---|
| ChTry MALDI |
 |
|---|
| ArgC MALDI |
 |
|---|
| LysN MALDI |
 |
|---|
| TryLysC MALDI |
 |
|---|
| Try LTQ |
 |
|---|
| ChTry LTQ |
 |
|---|
| ArgC LTQ |
 |
|---|
| LysN LTQ |
 |
|---|
| TryLysC LTQ |
 |
|---|
| Try MSlow |
 |
|---|
| ChTry MSlow |
 |
|---|
| ArgC MSlow |
 |
|---|
| LysN MSlow |
 |
|---|
| TryLysC MSlow |
 |
|---|
| Try MShigh |
 |
|---|
| ChTry MShigh |
 |
|---|
| ArgC MShigh |
 |
|---|
| LysN MShigh |
 |
|---|
| TryLysC MShigh |
 |
|---|
General Statistics
Number of major isoforms |
Number of additional isoforms |
Number of all proteins |
Number of amino acids |
Min. Seq. Length |
Max. Seq. Length |
Avg. Seq. Length |
Avg. Mol. Weight |
|---|---|---|---|---|---|---|---|
0 |
1003784 |
38 |
3110 |
330.6 |
35.35 |
Amino acid frequency
Ala |
Cys |
Asp |
Glu |
Phe |
Gly |
His |
Ile |
Lys |
Leu |
|---|---|---|---|---|---|---|---|---|---|
13.769 ± 0.065 | 0.472 ± 0.009 |
6.407 ± 0.037 | 5.734 ± 0.041 |
3.208 ± 0.03 | 9.007 ± 0.048 |
1.939 ± 0.023 | 4.544 ± 0.031 |
1.803 ± 0.033 | 9.973 ± 0.057 |
Met |
Asn |
Gln |
Pro |
Arg |
Ser |
Thr |
Val |
Trp |
Tyr |
|---|---|---|---|---|---|---|---|---|---|
1.762 ± 0.02 | 1.831 ± 0.027 |
5.5 ± 0.029 | 2.639 ± 0.024 |
7.256 ± 0.052 | 5.46 ± 0.033 |
5.958 ± 0.051 | 9.122 ± 0.043 |
1.617 ± 0.021 | 1.998 ± 0.022 |
Most of the basic statistics you can see at this page can be downloaded from this CSV file
Proteome-pI is available under Creative Commons Attribution-NoDerivs license, for more details see here
| Reference: Kozlowski LP. Proteome-pI 2.0: Proteome Isoelectric Point Database Update. Nucleic Acids Res. 2021, doi: 10.1093/nar/gkab944 | Contact: Lukasz P. Kozlowski |
