Anaerotruncus colihominis DSM 17241
Taxonomy: cellular organisms; Bacteria; Terrabacteria group; Firmicutes; Clostridia; Eubacteriales; Oscillospiraceae; Anaerotruncus; Anaerotruncus colihominis
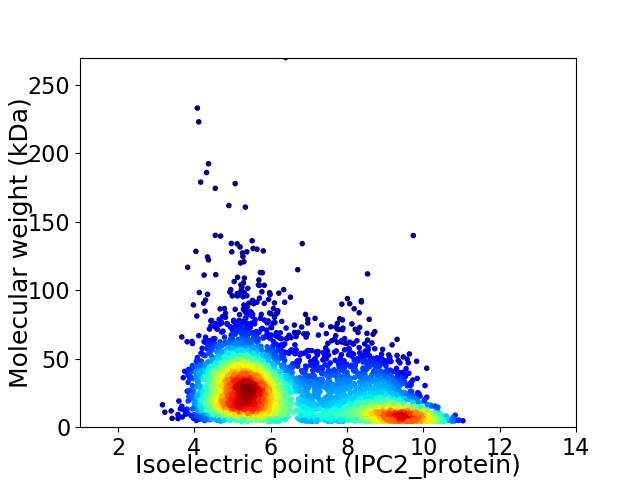
Average proteome isoelectric point is 6.58
Get precalculated fractions of proteins

Virtual 2D-PAGE plot for 4421 proteins (isoelectric point calculated using IPC2_protein)
Get csv file with sequences according to given criteria:
* You can choose from 21 different methods for calculating isoelectric point
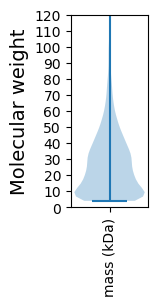
Summary statistics related to proteome-wise predictions


Protein with the lowest isoelectric point:
>tr|B0PC25|B0PC25_9FIRM NLPA lipoprotein OS=Anaerotruncus colihominis DSM 17241 OX=445972 GN=ANACOL_02334 PE=3 SV=1
MM1 pKa = 7.45KK2 pKa = 10.34KK3 pKa = 9.75ILALTLALCMLFTSMVGCSSGSDD26 pKa = 3.09TTAAGTGSNTSTEE39 pKa = 4.2AGTTQPDD46 pKa = 3.37TGDD49 pKa = 3.58AEE51 pKa = 4.52ASEE54 pKa = 4.96EE55 pKa = 4.03PTEE58 pKa = 4.3TNDD61 pKa = 5.4DD62 pKa = 3.74PTADD66 pKa = 3.77LQVSEE71 pKa = 5.06DD72 pKa = 3.44APTYY76 pKa = 10.91VMVSKK81 pKa = 9.46TLSDD85 pKa = 3.51PVFIDD90 pKa = 3.14MYY92 pKa = 9.96IGFRR96 pKa = 11.84EE97 pKa = 4.15FCEE100 pKa = 4.53SIGANCMYY108 pKa = 10.11RR109 pKa = 11.84GSDD112 pKa = 3.13EE113 pKa = 3.91PTAEE117 pKa = 4.26KK118 pKa = 10.13EE119 pKa = 4.01IEE121 pKa = 4.57IITQLMAQGVDD132 pKa = 3.35GLAVIAADD140 pKa = 4.51FDD142 pKa = 3.94ALEE145 pKa = 4.38PVLTQAMGQGIAVVTFDD162 pKa = 4.3SAANPDD168 pKa = 3.35SRR170 pKa = 11.84QLHH173 pKa = 5.48VEE175 pKa = 3.81QASIDD180 pKa = 3.87LVGRR184 pKa = 11.84DD185 pKa = 3.59QMKK188 pKa = 10.32SALEE192 pKa = 4.13IIGGPGAEE200 pKa = 3.96GTVGILSAQPEE211 pKa = 4.68SQLHH215 pKa = 6.44ADD217 pKa = 3.47WCNAMLKK224 pKa = 10.0EE225 pKa = 4.53VEE227 pKa = 4.79DD228 pKa = 4.04NPEE231 pKa = 3.79DD232 pKa = 3.8FANVTVLPIAYY243 pKa = 10.05GDD245 pKa = 4.17DD246 pKa = 4.29LPDD249 pKa = 3.88KK250 pKa = 10.4STTEE254 pKa = 3.92AQAMLQNYY262 pKa = 8.99PDD264 pKa = 3.76IDD266 pKa = 4.32VIISPTTVGILSAAKK281 pKa = 9.83VIQDD285 pKa = 3.67MGSEE289 pKa = 4.24CKK291 pKa = 9.13VTGVGLPSEE300 pKa = 4.16MAPYY304 pKa = 9.72IEE306 pKa = 5.9SGICYY311 pKa = 10.06DD312 pKa = 3.82CYY314 pKa = 11.06LWNPYY319 pKa = 9.58DD320 pKa = 3.58QGYY323 pKa = 8.72LAAASVNSISTGEE336 pKa = 4.09STGAVGDD343 pKa = 3.94TVTAGRR349 pKa = 11.84LGEE352 pKa = 4.22YY353 pKa = 9.03TVEE356 pKa = 4.1EE357 pKa = 5.03YY358 pKa = 11.3YY359 pKa = 11.04DD360 pKa = 3.91GGTQVLLGDD369 pKa = 4.81PIRR372 pKa = 11.84FTKK375 pKa = 10.33EE376 pKa = 3.45NIGEE380 pKa = 4.18YY381 pKa = 10.36KK382 pKa = 10.75DD383 pKa = 4.21LFF385 pKa = 4.8
MM1 pKa = 7.45KK2 pKa = 10.34KK3 pKa = 9.75ILALTLALCMLFTSMVGCSSGSDD26 pKa = 3.09TTAAGTGSNTSTEE39 pKa = 4.2AGTTQPDD46 pKa = 3.37TGDD49 pKa = 3.58AEE51 pKa = 4.52ASEE54 pKa = 4.96EE55 pKa = 4.03PTEE58 pKa = 4.3TNDD61 pKa = 5.4DD62 pKa = 3.74PTADD66 pKa = 3.77LQVSEE71 pKa = 5.06DD72 pKa = 3.44APTYY76 pKa = 10.91VMVSKK81 pKa = 9.46TLSDD85 pKa = 3.51PVFIDD90 pKa = 3.14MYY92 pKa = 9.96IGFRR96 pKa = 11.84EE97 pKa = 4.15FCEE100 pKa = 4.53SIGANCMYY108 pKa = 10.11RR109 pKa = 11.84GSDD112 pKa = 3.13EE113 pKa = 3.91PTAEE117 pKa = 4.26KK118 pKa = 10.13EE119 pKa = 4.01IEE121 pKa = 4.57IITQLMAQGVDD132 pKa = 3.35GLAVIAADD140 pKa = 4.51FDD142 pKa = 3.94ALEE145 pKa = 4.38PVLTQAMGQGIAVVTFDD162 pKa = 4.3SAANPDD168 pKa = 3.35SRR170 pKa = 11.84QLHH173 pKa = 5.48VEE175 pKa = 3.81QASIDD180 pKa = 3.87LVGRR184 pKa = 11.84DD185 pKa = 3.59QMKK188 pKa = 10.32SALEE192 pKa = 4.13IIGGPGAEE200 pKa = 3.96GTVGILSAQPEE211 pKa = 4.68SQLHH215 pKa = 6.44ADD217 pKa = 3.47WCNAMLKK224 pKa = 10.0EE225 pKa = 4.53VEE227 pKa = 4.79DD228 pKa = 4.04NPEE231 pKa = 3.79DD232 pKa = 3.8FANVTVLPIAYY243 pKa = 10.05GDD245 pKa = 4.17DD246 pKa = 4.29LPDD249 pKa = 3.88KK250 pKa = 10.4STTEE254 pKa = 3.92AQAMLQNYY262 pKa = 8.99PDD264 pKa = 3.76IDD266 pKa = 4.32VIISPTTVGILSAAKK281 pKa = 9.83VIQDD285 pKa = 3.67MGSEE289 pKa = 4.24CKK291 pKa = 9.13VTGVGLPSEE300 pKa = 4.16MAPYY304 pKa = 9.72IEE306 pKa = 5.9SGICYY311 pKa = 10.06DD312 pKa = 3.82CYY314 pKa = 11.06LWNPYY319 pKa = 9.58DD320 pKa = 3.58QGYY323 pKa = 8.72LAAASVNSISTGEE336 pKa = 4.09STGAVGDD343 pKa = 3.94TVTAGRR349 pKa = 11.84LGEE352 pKa = 4.22YY353 pKa = 9.03TVEE356 pKa = 4.1EE357 pKa = 5.03YY358 pKa = 11.3YY359 pKa = 11.04DD360 pKa = 3.91GGTQVLLGDD369 pKa = 4.81PIRR372 pKa = 11.84FTKK375 pKa = 10.33EE376 pKa = 3.45NIGEE380 pKa = 4.18YY381 pKa = 10.36KK382 pKa = 10.75DD383 pKa = 4.21LFF385 pKa = 4.8
Molecular weight: 40.79 kDa
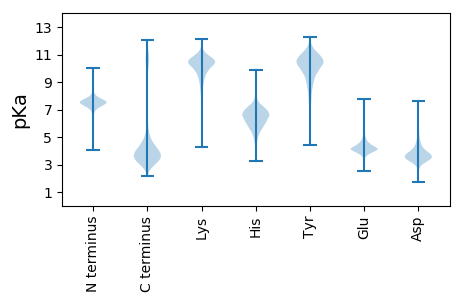
Isoelectric point according different methods:
Protein with the highest isoelectric point:
>tr|B0P7H2|B0P7H2_9FIRM Uncharacterized protein OS=Anaerotruncus colihominis DSM 17241 OX=445972 GN=ANACOL_00703 PE=4 SV=1
MM1 pKa = 7.5KK2 pKa = 10.12KK3 pKa = 9.97FHH5 pKa = 5.45VTRR8 pKa = 11.84KK9 pKa = 7.37TVLTIVGVTLPLTAAAILLPRR30 pKa = 11.84LKK32 pKa = 10.11RR33 pKa = 11.84SRR35 pKa = 11.84RR36 pKa = 11.84ARR38 pKa = 11.84SVRR41 pKa = 11.84AA42 pKa = 3.42
MM1 pKa = 7.5KK2 pKa = 10.12KK3 pKa = 9.97FHH5 pKa = 5.45VTRR8 pKa = 11.84KK9 pKa = 7.37TVLTIVGVTLPLTAAAILLPRR30 pKa = 11.84LKK32 pKa = 10.11RR33 pKa = 11.84SRR35 pKa = 11.84RR36 pKa = 11.84ARR38 pKa = 11.84SVRR41 pKa = 11.84AA42 pKa = 3.42
Molecular weight: 4.73 kDa
Isoelectric point according different methods:
Peptides (in silico digests for buttom-up proteomics)
Below you can find in silico digests of the whole proteome with Trypsin, Chymotrypsin, Trypsin+LysC, LysN, ArgC proteases suitable for different mass spec machines.| Try ESI |
 |
|---|
| ChTry ESI |
 |
|---|
| ArgC ESI |
 |
|---|
| LysN ESI |
 |
|---|
| TryLysC ESI |
 |
|---|
| Try MALDI |
 |
|---|
| ChTry MALDI |
 |
|---|
| ArgC MALDI |
 |
|---|
| LysN MALDI |
 |
|---|
| TryLysC MALDI |
 |
|---|
| Try LTQ |
 |
|---|
| ChTry LTQ |
 |
|---|
| ArgC LTQ |
 |
|---|
| LysN LTQ |
 |
|---|
| TryLysC LTQ |
 |
|---|
| Try MSlow |
 |
|---|
| ChTry MSlow |
 |
|---|
| ArgC MSlow |
 |
|---|
| LysN MSlow |
 |
|---|
| TryLysC MSlow |
 |
|---|
| Try MShigh |
 |
|---|
| ChTry MShigh |
 |
|---|
| ArgC MShigh |
 |
|---|
| LysN MShigh |
 |
|---|
| TryLysC MShigh |
 |
|---|
General Statistics
Number of major isoforms |
Number of additional isoforms |
Number of all proteins |
Number of amino acids |
Min. Seq. Length |
Max. Seq. Length |
Avg. Seq. Length |
Avg. Mol. Weight |
|---|---|---|---|---|---|---|---|
0 |
1126561 |
39 |
2434 |
254.8 |
28.14 |
Amino acid frequency
Ala |
Cys |
Asp |
Glu |
Phe |
Gly |
His |
Ile |
Lys |
Leu |
|---|---|---|---|---|---|---|---|---|---|
9.958 ± 0.061 | 1.725 ± 0.02 |
5.623 ± 0.039 | 6.35 ± 0.04 |
4.03 ± 0.026 | 7.799 ± 0.041 |
1.772 ± 0.018 | 6.24 ± 0.043 |
4.781 ± 0.035 | 9.487 ± 0.043 |
Met |
Asn |
Gln |
Pro |
Arg |
Ser |
Thr |
Val |
Trp |
Tyr |
|---|---|---|---|---|---|---|---|---|---|
2.929 ± 0.02 | 3.402 ± 0.025 |
4.23 ± 0.031 | 3.545 ± 0.024 |
5.958 ± 0.043 | 5.674 ± 0.036 |
5.224 ± 0.029 | 6.895 ± 0.037 |
0.969 ± 0.015 | 3.408 ± 0.027 |
Most of the basic statistics you can see at this page can be downloaded from this CSV file
Proteome-pI is available under Creative Commons Attribution-NoDerivs license, for more details see here
| Reference: Kozlowski LP. Proteome-pI 2.0: Proteome Isoelectric Point Database Update. Nucleic Acids Res. 2021, doi: 10.1093/nar/gkab944 | Contact: Lukasz P. Kozlowski |
