Bacillus infantis NRRL B-14911
Taxonomy: cellular organisms; Bacteria; Terrabacteria group; Firmicutes; Bacilli; Bacillales; Bacillaceae; Bacillus; Bacillus infantis
Average proteome isoelectric point is 6.3
Get precalculated fractions of proteins

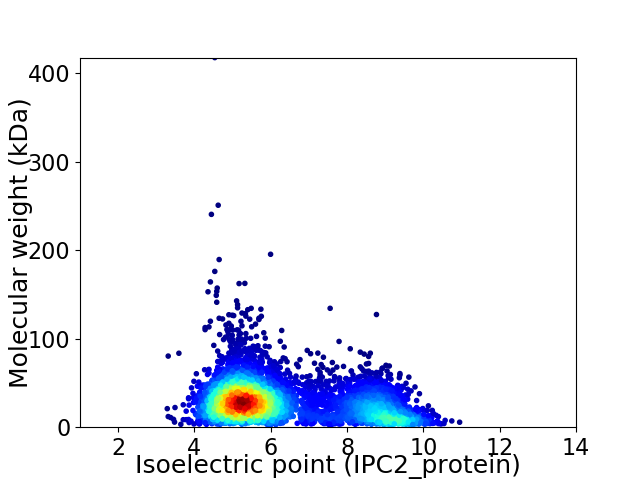
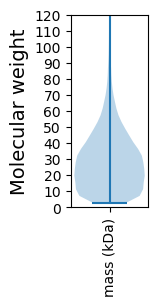
Virtual 2D-PAGE plot for 5066 proteins (isoelectric point calculated using IPC2_protein)
Get csv file with sequences according to given criteria:
* You can choose from 21 different methods for calculating isoelectric point
Summary statistics related to proteome-wise predictions


Protein with the lowest isoelectric point:
>tr|U5L9X9|U5L9X9_9BACI Sulfate adenylyltransferase OS=Bacillus infantis NRRL B-14911 OX=1367477 GN=sat PE=3 SV=1
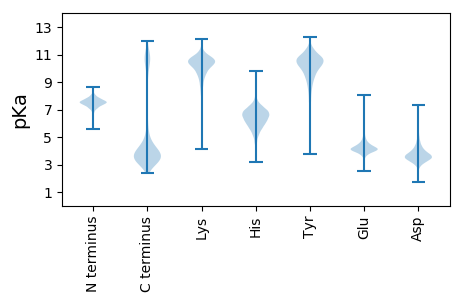
MM1 pKa = 7.54KK2 pKa = 9.74PHH4 pKa = 7.07KK5 pKa = 10.24RR6 pKa = 11.84PQLTPNNVQEE16 pKa = 3.94EE17 pKa = 4.97CIRR20 pKa = 11.84VSKK23 pKa = 10.81VYY25 pKa = 10.63DD26 pKa = 3.37WVFDD30 pKa = 5.17AITTDD35 pKa = 3.23TGITLPPDD43 pKa = 3.59CEE45 pKa = 4.02AAVALAVAEE54 pKa = 4.26GRR56 pKa = 11.84TPLDD60 pKa = 3.32VTCCVPDD67 pKa = 3.27VGGFFPLDD75 pKa = 3.78PPDD78 pKa = 3.51TDD80 pKa = 4.64GNATCTVSSRR90 pKa = 11.84IEE92 pKa = 3.72RR93 pKa = 11.84RR94 pKa = 11.84KK95 pKa = 9.93IPVNGVMTDD104 pKa = 3.44LAIVKK109 pKa = 9.07VIFTIRR115 pKa = 11.84PLVTIYY121 pKa = 10.94DD122 pKa = 3.61STGAVICSFRR132 pKa = 11.84PTISEE137 pKa = 3.72SRR139 pKa = 11.84RR140 pKa = 11.84LVVCAPEE147 pKa = 4.86PFTSDD152 pKa = 3.05NVFCRR157 pKa = 11.84LISLNCEE164 pKa = 3.81TNFIEE169 pKa = 5.04TGIPDD174 pKa = 3.52VGLQIMLDD182 pKa = 3.2ICFEE186 pKa = 4.14IQVEE190 pKa = 4.17ADD192 pKa = 3.29VKK194 pKa = 11.4LEE196 pKa = 3.91VLAKK200 pKa = 10.42FCFPRR205 pKa = 11.84PNDD208 pKa = 3.25IVIPPGGVCPPFEE221 pKa = 4.38WPEE224 pKa = 3.72QCDD227 pKa = 3.51FFPRR231 pKa = 11.84DD232 pKa = 3.42NCDD235 pKa = 3.04CQAFVDD241 pKa = 4.24TDD243 pKa = 5.0PITGPVPIVFSPILFAEE260 pKa = 4.6DD261 pKa = 3.64LAAGTYY267 pKa = 6.09TTEE270 pKa = 4.35LRR272 pKa = 11.84AEE274 pKa = 4.1ICDD277 pKa = 3.52NCQLTGSTLQWIVEE291 pKa = 4.3DD292 pKa = 4.24FVVPTGTGTLAVDD305 pKa = 3.1QSFVFTAEE313 pKa = 3.98EE314 pKa = 4.52FNMPTCSTVLGITTLTVTGAGTIVFSDD341 pKa = 3.75PSVTDD346 pKa = 3.46RR347 pKa = 11.84TALFTLTLVEE357 pKa = 5.35NIGTDD362 pKa = 3.36LDD364 pKa = 4.19AYY366 pKa = 10.98SITLTDD372 pKa = 3.06IAGAPLVTFAGAGTGFVPDD391 pKa = 4.38EE392 pKa = 4.31DD393 pKa = 6.38LIIQDD398 pKa = 4.37CVTFPNLLGGQPLL411 pKa = 3.4
MM1 pKa = 7.54KK2 pKa = 9.74PHH4 pKa = 7.07KK5 pKa = 10.24RR6 pKa = 11.84PQLTPNNVQEE16 pKa = 3.94EE17 pKa = 4.97CIRR20 pKa = 11.84VSKK23 pKa = 10.81VYY25 pKa = 10.63DD26 pKa = 3.37WVFDD30 pKa = 5.17AITTDD35 pKa = 3.23TGITLPPDD43 pKa = 3.59CEE45 pKa = 4.02AAVALAVAEE54 pKa = 4.26GRR56 pKa = 11.84TPLDD60 pKa = 3.32VTCCVPDD67 pKa = 3.27VGGFFPLDD75 pKa = 3.78PPDD78 pKa = 3.51TDD80 pKa = 4.64GNATCTVSSRR90 pKa = 11.84IEE92 pKa = 3.72RR93 pKa = 11.84RR94 pKa = 11.84KK95 pKa = 9.93IPVNGVMTDD104 pKa = 3.44LAIVKK109 pKa = 9.07VIFTIRR115 pKa = 11.84PLVTIYY121 pKa = 10.94DD122 pKa = 3.61STGAVICSFRR132 pKa = 11.84PTISEE137 pKa = 3.72SRR139 pKa = 11.84RR140 pKa = 11.84LVVCAPEE147 pKa = 4.86PFTSDD152 pKa = 3.05NVFCRR157 pKa = 11.84LISLNCEE164 pKa = 3.81TNFIEE169 pKa = 5.04TGIPDD174 pKa = 3.52VGLQIMLDD182 pKa = 3.2ICFEE186 pKa = 4.14IQVEE190 pKa = 4.17ADD192 pKa = 3.29VKK194 pKa = 11.4LEE196 pKa = 3.91VLAKK200 pKa = 10.42FCFPRR205 pKa = 11.84PNDD208 pKa = 3.25IVIPPGGVCPPFEE221 pKa = 4.38WPEE224 pKa = 3.72QCDD227 pKa = 3.51FFPRR231 pKa = 11.84DD232 pKa = 3.42NCDD235 pKa = 3.04CQAFVDD241 pKa = 4.24TDD243 pKa = 5.0PITGPVPIVFSPILFAEE260 pKa = 4.6DD261 pKa = 3.64LAAGTYY267 pKa = 6.09TTEE270 pKa = 4.35LRR272 pKa = 11.84AEE274 pKa = 4.1ICDD277 pKa = 3.52NCQLTGSTLQWIVEE291 pKa = 4.3DD292 pKa = 4.24FVVPTGTGTLAVDD305 pKa = 3.1QSFVFTAEE313 pKa = 3.98EE314 pKa = 4.52FNMPTCSTVLGITTLTVTGAGTIVFSDD341 pKa = 3.75PSVTDD346 pKa = 3.46RR347 pKa = 11.84TALFTLTLVEE357 pKa = 5.35NIGTDD362 pKa = 3.36LDD364 pKa = 4.19AYY366 pKa = 10.98SITLTDD372 pKa = 3.06IAGAPLVTFAGAGTGFVPDD391 pKa = 4.38EE392 pKa = 4.31DD393 pKa = 6.38LIIQDD398 pKa = 4.37CVTFPNLLGGQPLL411 pKa = 3.4
Molecular weight: 44.42 kDa
Isoelectric point according different methods:
Protein with the highest isoelectric point:
>tr|U5LGP7|U5LGP7_9BACI Succinate dehydrogenase OS=Bacillus infantis NRRL B-14911 OX=1367477 GN=N288_19350 PE=3 SV=1
MM1 pKa = 8.07RR2 pKa = 11.84YY3 pKa = 9.34ILLLLIVIPAAEE15 pKa = 4.24IGVLLLSGKK24 pKa = 10.46VIGVWLTILLIICTGLLGAYY44 pKa = 8.54LAKK47 pKa = 10.48KK48 pKa = 10.03QGLEE52 pKa = 3.94TIRR55 pKa = 11.84RR56 pKa = 11.84VQEE59 pKa = 3.55QLGRR63 pKa = 11.84GQLPGDD69 pKa = 3.63AVLDD73 pKa = 4.81GICILVGGTLLLTPGFITDD92 pKa = 3.06ITGFLLLLPPSRR104 pKa = 11.84IFFKK108 pKa = 10.89NILMKK113 pKa = 10.26IFRR116 pKa = 11.84SRR118 pKa = 11.84IQRR121 pKa = 11.84GNIKK125 pKa = 10.17IIRR128 pKa = 3.95
MM1 pKa = 8.07RR2 pKa = 11.84YY3 pKa = 9.34ILLLLIVIPAAEE15 pKa = 4.24IGVLLLSGKK24 pKa = 10.46VIGVWLTILLIICTGLLGAYY44 pKa = 8.54LAKK47 pKa = 10.48KK48 pKa = 10.03QGLEE52 pKa = 3.94TIRR55 pKa = 11.84RR56 pKa = 11.84VQEE59 pKa = 3.55QLGRR63 pKa = 11.84GQLPGDD69 pKa = 3.63AVLDD73 pKa = 4.81GICILVGGTLLLTPGFITDD92 pKa = 3.06ITGFLLLLPPSRR104 pKa = 11.84IFFKK108 pKa = 10.89NILMKK113 pKa = 10.26IFRR116 pKa = 11.84SRR118 pKa = 11.84IQRR121 pKa = 11.84GNIKK125 pKa = 10.17IIRR128 pKa = 3.95
Molecular weight: 14.08 kDa
Isoelectric point according different methods:
Peptides (in silico digests for buttom-up proteomics)
Below you can find in silico digests of the whole proteome with Trypsin, Chymotrypsin, Trypsin+LysC, LysN, ArgC proteases suitable for different mass spec machines.| Try ESI |
 |
|---|
| ChTry ESI |
 |
|---|
| ArgC ESI |
 |
|---|
| LysN ESI |
 |
|---|
| TryLysC ESI |
 |
|---|
| Try MALDI |
 |
|---|
| ChTry MALDI |
 |
|---|
| ArgC MALDI |
 |
|---|
| LysN MALDI |
 |
|---|
| TryLysC MALDI |
 |
|---|
| Try LTQ |
 |
|---|
| ChTry LTQ |
 |
|---|
| ArgC LTQ |
 |
|---|
| LysN LTQ |
 |
|---|
| TryLysC LTQ |
 |
|---|
| Try MSlow |
 |
|---|
| ChTry MSlow |
 |
|---|
| ArgC MSlow |
 |
|---|
| LysN MSlow |
 |
|---|
| TryLysC MSlow |
 |
|---|
| Try MShigh |
 |
|---|
| ChTry MShigh |
 |
|---|
| ArgC MShigh |
 |
|---|
| LysN MShigh |
 |
|---|
| TryLysC MShigh |
 |
|---|
General Statistics
Number of major isoforms |
Number of additional isoforms |
Number of all proteins |
Number of amino acids |
Min. Seq. Length |
Max. Seq. Length |
Avg. Seq. Length |
Avg. Mol. Weight |
|---|---|---|---|---|---|---|---|
0 |
1383718 |
26 |
3826 |
273.1 |
30.5 |
Amino acid frequency
Ala |
Cys |
Asp |
Glu |
Phe |
Gly |
His |
Ile |
Lys |
Leu |
|---|---|---|---|---|---|---|---|---|---|
8.073 ± 0.046 | 0.708 ± 0.01 |
5.057 ± 0.031 | 7.915 ± 0.052 |
4.614 ± 0.032 | 7.46 ± 0.035 |
1.953 ± 0.017 | 7.394 ± 0.032 |
6.647 ± 0.031 | 9.979 ± 0.037 |
Met |
Asn |
Gln |
Pro |
Arg |
Ser |
Thr |
Val |
Trp |
Tyr |
|---|---|---|---|---|---|---|---|---|---|
2.838 ± 0.018 | 3.802 ± 0.023 |
3.746 ± 0.02 | 3.459 ± 0.026 |
4.326 ± 0.031 | 6.357 ± 0.03 |
4.807 ± 0.024 | 6.367 ± 0.031 |
1.047 ± 0.016 | 3.452 ± 0.023 |
Most of the basic statistics you can see at this page can be downloaded from this CSV file
Proteome-pI is available under Creative Commons Attribution-NoDerivs license, for more details see here
| Reference: Kozlowski LP. Proteome-pI 2.0: Proteome Isoelectric Point Database Update. Nucleic Acids Res. 2021, doi: 10.1093/nar/gkab944 | Contact: Lukasz P. Kozlowski |
