Erythrobacter litoralis (strain HTCC2594)
Taxonomy: cellular organisms; Bacteria; Proteobacteria; Alphaproteobacteria; Sphingomonadales; Erythrobacteraceae; Erythrobacter/Porphyrobacter group; Erythrobacter; Erythrobacter litoralis
Average proteome isoelectric point is 5.91
Get precalculated fractions of proteins

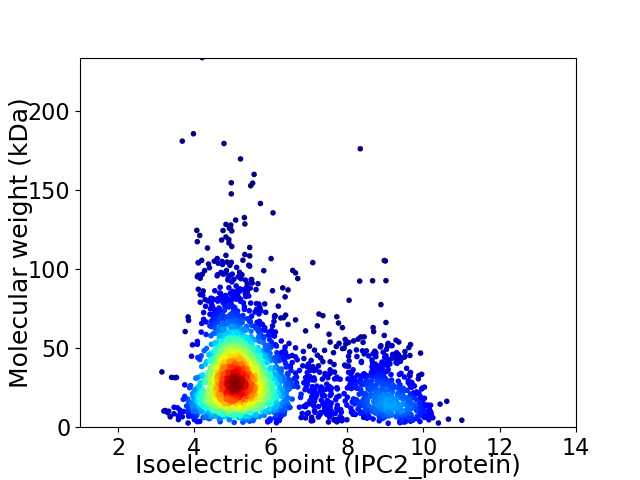
Virtual 2D-PAGE plot for 2999 proteins (isoelectric point calculated using IPC2_protein)
Get csv file with sequences according to given criteria:
* You can choose from 21 different methods for calculating isoelectric point
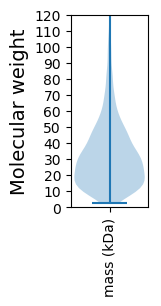
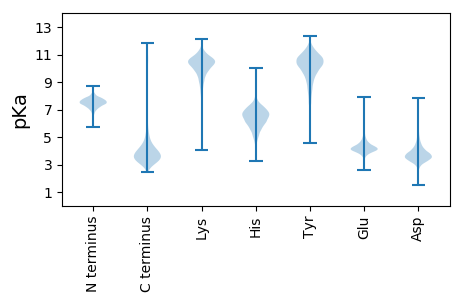
Summary statistics related to proteome-wise predictions


Protein with the lowest isoelectric point:
>tr|Q2N5Y4|Q2N5Y4_ERYLH Serine palmitoyltransferase OS=Erythrobacter litoralis (strain HTCC2594) OX=314225 GN=ELI_14075 PE=3 SV=1
MM1 pKa = 7.18ATADD5 pKa = 4.47LEE7 pKa = 4.39YY8 pKa = 10.57LYY10 pKa = 11.04AALLQDD16 pKa = 3.66MVSADD21 pKa = 4.1EE22 pKa = 4.06QSLALTEE29 pKa = 4.16RR30 pKa = 11.84LRR32 pKa = 11.84DD33 pKa = 3.39AATSEE38 pKa = 4.21DD39 pKa = 4.14LRR41 pKa = 11.84DD42 pKa = 3.68ALEE45 pKa = 5.24DD46 pKa = 4.14GVCGIGDD53 pKa = 3.76GLEE56 pKa = 4.08IARR59 pKa = 11.84KK60 pKa = 8.87LAEE63 pKa = 4.31AHH65 pKa = 6.6PADD68 pKa = 4.73DD69 pKa = 6.45GEE71 pKa = 4.3FQSDD75 pKa = 3.3GMAGLVTDD83 pKa = 3.45TQEE86 pKa = 4.41RR87 pKa = 11.84VFEE90 pKa = 4.17TDD92 pKa = 3.38FASGSARR99 pKa = 11.84DD100 pKa = 3.72AAILAQYY107 pKa = 8.35MHH109 pKa = 6.81LTYY112 pKa = 10.68YY113 pKa = 11.0GLAGYY118 pKa = 7.61RR119 pKa = 11.84TLAAIASQLGHH130 pKa = 7.07ADD132 pKa = 3.53EE133 pKa = 6.58AEE135 pKa = 4.17DD136 pKa = 5.14LQTCYY141 pKa = 10.93EE142 pKa = 4.07NAQDD146 pKa = 4.77GQDD149 pKa = 4.2DD150 pKa = 4.67MIGLLDD156 pKa = 4.04GEE158 pKa = 4.61VLEE161 pKa = 4.93DD162 pKa = 3.54TAA164 pKa = 5.9
MM1 pKa = 7.18ATADD5 pKa = 4.47LEE7 pKa = 4.39YY8 pKa = 10.57LYY10 pKa = 11.04AALLQDD16 pKa = 3.66MVSADD21 pKa = 4.1EE22 pKa = 4.06QSLALTEE29 pKa = 4.16RR30 pKa = 11.84LRR32 pKa = 11.84DD33 pKa = 3.39AATSEE38 pKa = 4.21DD39 pKa = 4.14LRR41 pKa = 11.84DD42 pKa = 3.68ALEE45 pKa = 5.24DD46 pKa = 4.14GVCGIGDD53 pKa = 3.76GLEE56 pKa = 4.08IARR59 pKa = 11.84KK60 pKa = 8.87LAEE63 pKa = 4.31AHH65 pKa = 6.6PADD68 pKa = 4.73DD69 pKa = 6.45GEE71 pKa = 4.3FQSDD75 pKa = 3.3GMAGLVTDD83 pKa = 3.45TQEE86 pKa = 4.41RR87 pKa = 11.84VFEE90 pKa = 4.17TDD92 pKa = 3.38FASGSARR99 pKa = 11.84DD100 pKa = 3.72AAILAQYY107 pKa = 8.35MHH109 pKa = 6.81LTYY112 pKa = 10.68YY113 pKa = 11.0GLAGYY118 pKa = 7.61RR119 pKa = 11.84TLAAIASQLGHH130 pKa = 7.07ADD132 pKa = 3.53EE133 pKa = 6.58AEE135 pKa = 4.17DD136 pKa = 5.14LQTCYY141 pKa = 10.93EE142 pKa = 4.07NAQDD146 pKa = 4.77GQDD149 pKa = 4.2DD150 pKa = 4.67MIGLLDD156 pKa = 4.04GEE158 pKa = 4.61VLEE161 pKa = 4.93DD162 pKa = 3.54TAA164 pKa = 5.9
Molecular weight: 17.59 kDa
Isoelectric point according different methods:
Protein with the highest isoelectric point:
>tr|Q2NC79|Q2NC79_ERYLH Biotin carboxylase OS=Erythrobacter litoralis (strain HTCC2594) OX=314225 GN=ELI_03100 PE=4 SV=1
MM1 pKa = 7.1KK2 pKa = 10.16HH3 pKa = 6.16RR4 pKa = 11.84RR5 pKa = 11.84QTLLMILMRR14 pKa = 11.84FSIRR18 pKa = 11.84IWFVLSRR25 pKa = 11.84WLISLNRR32 pKa = 11.84RR33 pKa = 11.84HH34 pKa = 6.16
MM1 pKa = 7.1KK2 pKa = 10.16HH3 pKa = 6.16RR4 pKa = 11.84RR5 pKa = 11.84QTLLMILMRR14 pKa = 11.84FSIRR18 pKa = 11.84IWFVLSRR25 pKa = 11.84WLISLNRR32 pKa = 11.84RR33 pKa = 11.84HH34 pKa = 6.16
Molecular weight: 4.41 kDa
Isoelectric point according different methods:
Peptides (in silico digests for buttom-up proteomics)
Below you can find in silico digests of the whole proteome with Trypsin, Chymotrypsin, Trypsin+LysC, LysN, ArgC proteases suitable for different mass spec machines.| Try ESI |
 |
|---|
| ChTry ESI |
 |
|---|
| ArgC ESI |
 |
|---|
| LysN ESI |
 |
|---|
| TryLysC ESI |
 |
|---|
| Try MALDI |
 |
|---|
| ChTry MALDI |
 |
|---|
| ArgC MALDI |
 |
|---|
| LysN MALDI |
 |
|---|
| TryLysC MALDI |
 |
|---|
| Try LTQ |
 |
|---|
| ChTry LTQ |
 |
|---|
| ArgC LTQ |
 |
|---|
| LysN LTQ |
 |
|---|
| TryLysC LTQ |
 |
|---|
| Try MSlow |
 |
|---|
| ChTry MSlow |
 |
|---|
| ArgC MSlow |
 |
|---|
| LysN MSlow |
 |
|---|
| TryLysC MSlow |
 |
|---|
| Try MShigh |
 |
|---|
| ChTry MShigh |
 |
|---|
| ArgC MShigh |
 |
|---|
| LysN MShigh |
 |
|---|
| TryLysC MShigh |
 |
|---|
General Statistics
Number of major isoforms |
Number of additional isoforms |
Number of all proteins |
Number of amino acids |
Min. Seq. Length |
Max. Seq. Length |
Avg. Seq. Length |
Avg. Mol. Weight |
|---|---|---|---|---|---|---|---|
0 |
928556 |
23 |
2409 |
309.6 |
33.65 |
Amino acid frequency
Ala |
Cys |
Asp |
Glu |
Phe |
Gly |
His |
Ile |
Lys |
Leu |
|---|---|---|---|---|---|---|---|---|---|
12.305 ± 0.071 | 0.812 ± 0.014 |
6.349 ± 0.038 | 6.605 ± 0.047 |
3.699 ± 0.031 | 8.802 ± 0.044 |
1.915 ± 0.023 | 5.088 ± 0.029 |
3.326 ± 0.043 | 9.627 ± 0.049 |
Met |
Asn |
Gln |
Pro |
Arg |
Ser |
Thr |
Val |
Trp |
Tyr |
|---|---|---|---|---|---|---|---|---|---|
2.488 ± 0.028 | 2.628 ± 0.031 |
5.083 ± 0.035 | 3.222 ± 0.024 |
6.888 ± 0.04 | 5.341 ± 0.037 |
5.232 ± 0.044 | 6.943 ± 0.04 |
1.432 ± 0.02 | 2.216 ± 0.025 |
Most of the basic statistics you can see at this page can be downloaded from this CSV file
Proteome-pI is available under Creative Commons Attribution-NoDerivs license, for more details see here
| Reference: Kozlowski LP. Proteome-pI 2.0: Proteome Isoelectric Point Database Update. Nucleic Acids Res. 2021, doi: 10.1093/nar/gkab944 | Contact: Lukasz P. Kozlowski |
