Schistosoma bovis (Blood fluke)
Taxonomy: cellular organisms; Eukaryota; Opisthokonta; Metazoa; Eumetazoa; Bilateria; Protostomia; Spiralia; Lophotrochozoa; Platyhelminthes; Trematoda; Digenea; Strigeidida; Schistosomatoidea; Schistosomatidae; Schistosoma
Average proteome isoelectric point is 6.71
Get precalculated fractions of proteins
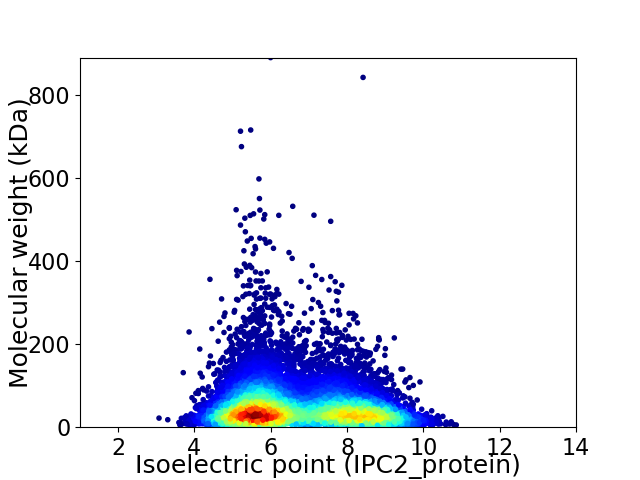
Virtual 2D-PAGE plot for 11348 proteins (isoelectric point calculated using IPC2_protein)
Get csv file with sequences according to given criteria:
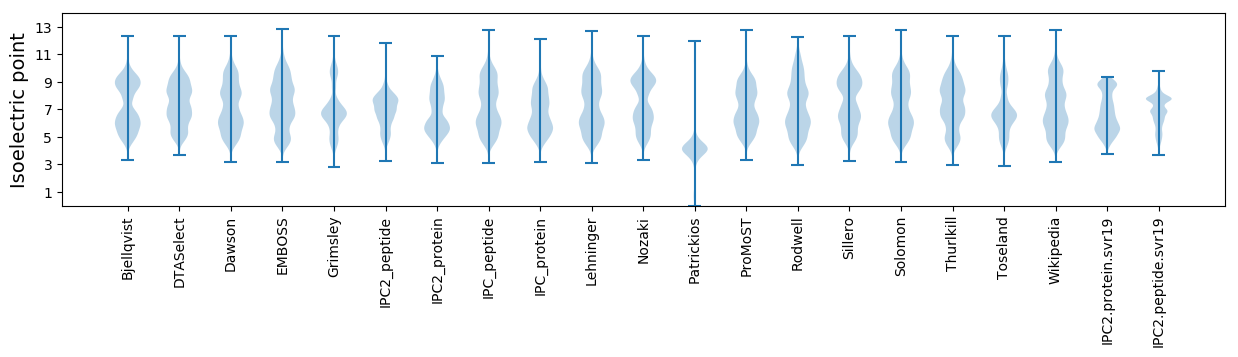
* You can choose from 21 different methods for calculating isoelectric point
Summary statistics related to proteome-wise predictions


Protein with the lowest isoelectric point:
>tr|A0A430QAF8|A0A430QAF8_SCHBO Uncharacterized protein OS=Schistosoma bovis OX=6184 GN=DC041_0008493 PE=4 SV=1
MM1 pKa = 7.06VADD4 pKa = 4.44GEE6 pKa = 4.4YY7 pKa = 10.75SDD9 pKa = 4.92VHH11 pKa = 6.37FLQSNISLYY20 pKa = 10.55EE21 pKa = 4.18DD22 pKa = 3.41SSLIDD27 pKa = 3.29TGTLKK32 pKa = 10.38ISEE35 pKa = 4.6EE36 pKa = 4.26CFTWEE41 pKa = 4.09GTSKK45 pKa = 10.53QFFIPYY51 pKa = 9.7SQITLHH57 pKa = 6.86AIARR61 pKa = 11.84NTVDD65 pKa = 3.17QTGDD69 pKa = 3.16HH70 pKa = 7.06PNNLFPHH77 pKa = 6.06PHH79 pKa = 6.59LLVMIDD85 pKa = 4.32GDD87 pKa = 4.68RR88 pKa = 11.84VWDD91 pKa = 4.14SNNTDD96 pKa = 3.49NLSDD100 pKa = 3.46TKK102 pKa = 11.04SQNEE106 pKa = 3.86QDD108 pKa = 3.7GMQIDD113 pKa = 4.34AEE115 pKa = 4.44GSDD118 pKa = 3.93EE119 pKa = 4.19EE120 pKa = 5.82KK121 pKa = 10.7EE122 pKa = 4.91DD123 pKa = 3.87SDD125 pKa = 4.48SDD127 pKa = 4.14RR128 pKa = 11.84APDD131 pKa = 3.96CPGSTSVLRR140 pKa = 11.84LVPQDD145 pKa = 3.53SAQLEE150 pKa = 4.28DD151 pKa = 4.11MYY153 pKa = 11.42KK154 pKa = 10.83ALADD158 pKa = 3.97CQALNPDD165 pKa = 4.39PEE167 pKa = 6.4DD168 pKa = 4.45DD169 pKa = 3.82NSDD172 pKa = 3.68FEE174 pKa = 5.68GFAEE178 pKa = 4.51DD179 pKa = 6.01DD180 pKa = 3.7EE181 pKa = 5.53YY182 pKa = 11.38EE183 pKa = 4.18INNQGMEE190 pKa = 4.51FEE192 pKa = 4.33NHH194 pKa = 5.6TNSEE198 pKa = 4.19FYY200 pKa = 10.76YY201 pKa = 11.02
MM1 pKa = 7.06VADD4 pKa = 4.44GEE6 pKa = 4.4YY7 pKa = 10.75SDD9 pKa = 4.92VHH11 pKa = 6.37FLQSNISLYY20 pKa = 10.55EE21 pKa = 4.18DD22 pKa = 3.41SSLIDD27 pKa = 3.29TGTLKK32 pKa = 10.38ISEE35 pKa = 4.6EE36 pKa = 4.26CFTWEE41 pKa = 4.09GTSKK45 pKa = 10.53QFFIPYY51 pKa = 9.7SQITLHH57 pKa = 6.86AIARR61 pKa = 11.84NTVDD65 pKa = 3.17QTGDD69 pKa = 3.16HH70 pKa = 7.06PNNLFPHH77 pKa = 6.06PHH79 pKa = 6.59LLVMIDD85 pKa = 4.32GDD87 pKa = 4.68RR88 pKa = 11.84VWDD91 pKa = 4.14SNNTDD96 pKa = 3.49NLSDD100 pKa = 3.46TKK102 pKa = 11.04SQNEE106 pKa = 3.86QDD108 pKa = 3.7GMQIDD113 pKa = 4.34AEE115 pKa = 4.44GSDD118 pKa = 3.93EE119 pKa = 4.19EE120 pKa = 5.82KK121 pKa = 10.7EE122 pKa = 4.91DD123 pKa = 3.87SDD125 pKa = 4.48SDD127 pKa = 4.14RR128 pKa = 11.84APDD131 pKa = 3.96CPGSTSVLRR140 pKa = 11.84LVPQDD145 pKa = 3.53SAQLEE150 pKa = 4.28DD151 pKa = 4.11MYY153 pKa = 11.42KK154 pKa = 10.83ALADD158 pKa = 3.97CQALNPDD165 pKa = 4.39PEE167 pKa = 6.4DD168 pKa = 4.45DD169 pKa = 3.82NSDD172 pKa = 3.68FEE174 pKa = 5.68GFAEE178 pKa = 4.51DD179 pKa = 6.01DD180 pKa = 3.7EE181 pKa = 5.53YY182 pKa = 11.38EE183 pKa = 4.18INNQGMEE190 pKa = 4.51FEE192 pKa = 4.33NHH194 pKa = 5.6TNSEE198 pKa = 4.19FYY200 pKa = 10.76YY201 pKa = 11.02
Molecular weight: 22.7 kDa
Isoelectric point according different methods:
Protein with the highest isoelectric point:
>tr|A0A430QB95|A0A430QB95_SCHBO Mitochondrial import inner membrane translocase subunit TIM22 OS=Schistosoma bovis OX=6184 GN=DC041_0010217 PE=3 SV=1
MM1 pKa = 7.77VDD3 pKa = 4.39DD4 pKa = 6.31RR5 pKa = 11.84LDD7 pKa = 3.61TLQKK11 pKa = 10.24EE12 pKa = 4.31INILCRR18 pKa = 11.84KK19 pKa = 8.11LTEE22 pKa = 3.73LTQRR26 pKa = 11.84EE27 pKa = 4.23KK28 pKa = 10.76PRR30 pKa = 11.84RR31 pKa = 11.84SSRR34 pKa = 11.84DD35 pKa = 2.82RR36 pKa = 11.84SRR38 pKa = 11.84EE39 pKa = 3.68RR40 pKa = 11.84TRR42 pKa = 11.84STSRR46 pKa = 11.84RR47 pKa = 11.84RR48 pKa = 11.84TTPAICWYY56 pKa = 9.42HH57 pKa = 7.18QMFGYY62 pKa = 10.08RR63 pKa = 11.84ARR65 pKa = 11.84KK66 pKa = 8.9CLQPCRR72 pKa = 11.84FNRR75 pKa = 11.84ASNRR79 pKa = 11.84YY80 pKa = 8.12PRR82 pKa = 11.84VSMATASTHH91 pKa = 6.06IMPEE95 pKa = 3.76NSRR98 pKa = 11.84LFYY101 pKa = 10.75IQDD104 pKa = 3.51RR105 pKa = 11.84TTGAQFLVDD114 pKa = 3.85TGAEE118 pKa = 3.86ISVVPPFNEE127 pKa = 3.38EE128 pKa = 3.7RR129 pKa = 11.84KK130 pKa = 10.31NINPSLVLRR139 pKa = 11.84AANKK143 pKa = 10.34SDD145 pKa = 2.25IKK147 pKa = 10.29TYY149 pKa = 10.32GKK151 pKa = 10.09RR152 pKa = 11.84QLSLDD157 pKa = 3.98FGRR160 pKa = 11.84GASYY164 pKa = 10.54RR165 pKa = 11.84WNFVIADD172 pKa = 3.47VSMPIIGIDD181 pKa = 3.48FLCNFDD187 pKa = 4.92LLVDD191 pKa = 4.0SRR193 pKa = 11.84RR194 pKa = 11.84HH195 pKa = 4.93RR196 pKa = 11.84LINGSQTTSIRR207 pKa = 11.84GG208 pKa = 3.33
MM1 pKa = 7.77VDD3 pKa = 4.39DD4 pKa = 6.31RR5 pKa = 11.84LDD7 pKa = 3.61TLQKK11 pKa = 10.24EE12 pKa = 4.31INILCRR18 pKa = 11.84KK19 pKa = 8.11LTEE22 pKa = 3.73LTQRR26 pKa = 11.84EE27 pKa = 4.23KK28 pKa = 10.76PRR30 pKa = 11.84RR31 pKa = 11.84SSRR34 pKa = 11.84DD35 pKa = 2.82RR36 pKa = 11.84SRR38 pKa = 11.84EE39 pKa = 3.68RR40 pKa = 11.84TRR42 pKa = 11.84STSRR46 pKa = 11.84RR47 pKa = 11.84RR48 pKa = 11.84TTPAICWYY56 pKa = 9.42HH57 pKa = 7.18QMFGYY62 pKa = 10.08RR63 pKa = 11.84ARR65 pKa = 11.84KK66 pKa = 8.9CLQPCRR72 pKa = 11.84FNRR75 pKa = 11.84ASNRR79 pKa = 11.84YY80 pKa = 8.12PRR82 pKa = 11.84VSMATASTHH91 pKa = 6.06IMPEE95 pKa = 3.76NSRR98 pKa = 11.84LFYY101 pKa = 10.75IQDD104 pKa = 3.51RR105 pKa = 11.84TTGAQFLVDD114 pKa = 3.85TGAEE118 pKa = 3.86ISVVPPFNEE127 pKa = 3.38EE128 pKa = 3.7RR129 pKa = 11.84KK130 pKa = 10.31NINPSLVLRR139 pKa = 11.84AANKK143 pKa = 10.34SDD145 pKa = 2.25IKK147 pKa = 10.29TYY149 pKa = 10.32GKK151 pKa = 10.09RR152 pKa = 11.84QLSLDD157 pKa = 3.98FGRR160 pKa = 11.84GASYY164 pKa = 10.54RR165 pKa = 11.84WNFVIADD172 pKa = 3.47VSMPIIGIDD181 pKa = 3.48FLCNFDD187 pKa = 4.92LLVDD191 pKa = 4.0SRR193 pKa = 11.84RR194 pKa = 11.84HH195 pKa = 4.93RR196 pKa = 11.84LINGSQTTSIRR207 pKa = 11.84GG208 pKa = 3.33
Molecular weight: 24.22 kDa
Isoelectric point according different methods:
Peptides (in silico digests for buttom-up proteomics)
Below you can find in silico digests of the whole proteome with Trypsin, Chymotrypsin, Trypsin+LysC, LysN, ArgC proteases suitable for different mass spec machines.| Try ESI |
 |
|---|
| ChTry ESI |
|
|---|
| ArgC ESI |
|
|---|
| LysN ESI |
|
|---|
| TryLysC ESI |
|
|---|
| Try MALDI |
|
|---|
| ChTry MALDI |
|
|---|
| ArgC MALDI |
|
|---|
| LysN MALDI |
|
|---|
| TryLysC MALDI |
|
|---|
| Try LTQ |
|
|---|
| ChTry LTQ |
|
|---|
| ArgC LTQ |
|
|---|
| LysN LTQ |
|
|---|
| TryLysC LTQ |
|
|---|
| Try MSlow |
|
|---|
| ChTry MSlow |
|
|---|
| ArgC MSlow |
|
|---|
| LysN MSlow |
|
|---|
| TryLysC MSlow |
|
|---|
| Try MShigh |
|
|---|
| ChTry MShigh |
|
|---|
| ArgC MShigh |
|
|---|
| LysN MShigh |
|
|---|
| TryLysC MShigh |
|
|---|
General Statistics
Number of major isoforms |
Number of additional isoforms |
Number of all proteins |
Number of amino acids |
Min. Seq. Length |
Max. Seq. Length |
Avg. Seq. Length |
Avg. Mol. Weight |
|---|---|---|---|---|---|---|---|
0 |
5570637 |
30 |
7935 |
490.9 |
55.49 |
Amino acid frequency
Ala |
Cys |
Asp |
Glu |
Phe |
Gly |
His |
Ile |
Lys |
Leu |
|---|---|---|---|---|---|---|---|---|---|
4.457 ± 0.024 | 2.117 ± 0.013 |
5.314 ± 0.018 | 5.481 ± 0.028 |
3.846 ± 0.016 | 4.312 ± 0.029 |
2.957 ± 0.014 | 6.705 ± 0.023 |
5.576 ± 0.025 | 9.697 ± 0.032 |
Met |
Asn |
Gln |
Pro |
Arg |
Ser |
Thr |
Val |
Trp |
Tyr |
|---|---|---|---|---|---|---|---|---|---|
1.963 ± 0.008 | 7.455 ± 0.034 |
4.606 ± 0.022 | 4.347 ± 0.016 |
4.774 ± 0.019 | 10.375 ± 0.038 |
6.442 ± 0.025 | 5.261 ± 0.018 |
0.962 ± 0.008 | 3.338 ± 0.013 |
Most of the basic statistics you can see at this page can be downloaded from this CSV file
See this proteome in:

Proteome-pI is available under Creative Commons Attribution-NoDerivs license, for more details see here
| Reference: Kozlowski LP. Proteome-pI 2.0: Proteome Isoelectric Point Database Update. Nucleic Acids Res. 2021, doi: 10.1093/nar/gkab944 | Contact: Lukasz P. Kozlowski |