Dyadobacter sp. Leaf189
Taxonomy: cellular organisms; Bacteria; FCB group; Bacteroidetes/Chlorobi group; Bacteroidetes; Cytophagia; Cytophagales; Cytophagaceae; Dyadobacter; unclassified Dyadobacter
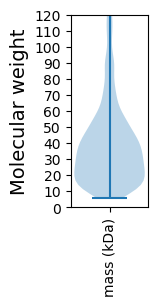
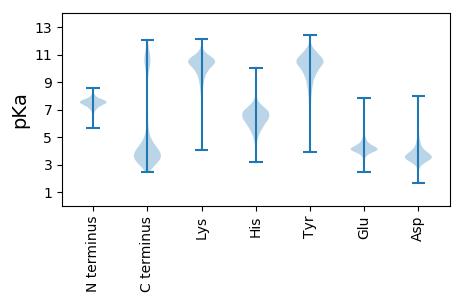
Average proteome isoelectric point is 6.61
Get precalculated fractions of proteins

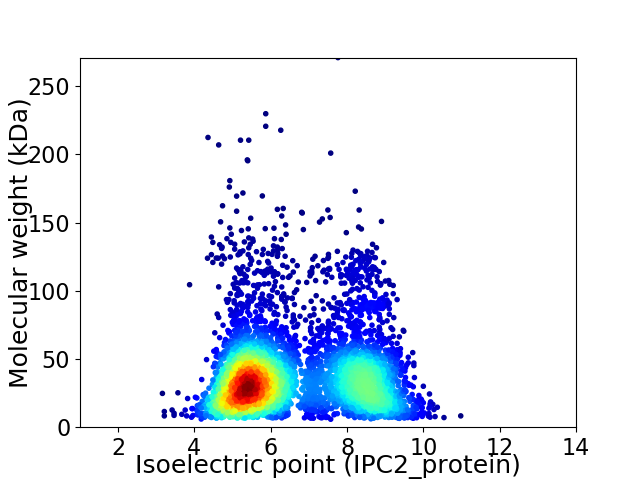
Virtual 2D-PAGE plot for 4994 proteins (isoelectric point calculated using IPC2_protein)
Get csv file with sequences according to given criteria:
* You can choose from 21 different methods for calculating isoelectric point
Summary statistics related to proteome-wise predictions


Protein with the lowest isoelectric point:
>tr|A0A0Q5TMC1|A0A0Q5TMC1_9BACT Dihydrodipicolinate synthetase OS=Dyadobacter sp. Leaf189 OX=1736295 GN=ASG33_10985 PE=3 SV=1
MM1 pKa = 6.97TQDD4 pKa = 2.89NCFLLGYY11 pKa = 9.76IVRR14 pKa = 11.84THH16 pKa = 5.52GTAGNVVFYY25 pKa = 11.13LDD27 pKa = 2.99VDD29 pKa = 3.99YY30 pKa = 11.24PDD32 pKa = 5.54DD33 pKa = 4.56YY34 pKa = 11.98EE35 pKa = 5.03DD36 pKa = 4.87LEE38 pKa = 4.56TVYY41 pKa = 11.12VEE43 pKa = 4.13IKK45 pKa = 10.68GDD47 pKa = 3.58LVPYY51 pKa = 10.04FIEE54 pKa = 5.67DD55 pKa = 3.52INIQKK60 pKa = 10.05QGNAIVALEE69 pKa = 4.37EE70 pKa = 4.22VNTMAKK76 pKa = 10.03AQALVGSSLYY86 pKa = 10.9LPLEE90 pKa = 4.43DD91 pKa = 5.47LEE93 pKa = 4.42EE94 pKa = 5.17LGGEE98 pKa = 3.65NFYY101 pKa = 10.99YY102 pKa = 10.64HH103 pKa = 7.36EE104 pKa = 4.52IKK106 pKa = 10.59GYY108 pKa = 7.4TVIDD112 pKa = 3.52QTAGEE117 pKa = 4.17LGIVRR122 pKa = 11.84EE123 pKa = 4.42VYY125 pKa = 10.6SLNGQDD131 pKa = 5.35LIAMDD136 pKa = 4.0YY137 pKa = 10.9EE138 pKa = 4.44GTEE141 pKa = 4.0VLIPTANEE149 pKa = 3.37IVQRR153 pKa = 11.84ADD155 pKa = 3.31KK156 pKa = 8.66EE157 pKa = 4.83TKK159 pKa = 9.76QLLVNLPEE167 pKa = 4.76GLLEE171 pKa = 4.34VYY173 pKa = 10.36LSKK176 pKa = 11.23DD177 pKa = 3.03SDD179 pKa = 4.09SEE181 pKa = 4.4NIPDD185 pKa = 5.14DD186 pKa = 4.21ADD188 pKa = 3.21
MM1 pKa = 6.97TQDD4 pKa = 2.89NCFLLGYY11 pKa = 9.76IVRR14 pKa = 11.84THH16 pKa = 5.52GTAGNVVFYY25 pKa = 11.13LDD27 pKa = 2.99VDD29 pKa = 3.99YY30 pKa = 11.24PDD32 pKa = 5.54DD33 pKa = 4.56YY34 pKa = 11.98EE35 pKa = 5.03DD36 pKa = 4.87LEE38 pKa = 4.56TVYY41 pKa = 11.12VEE43 pKa = 4.13IKK45 pKa = 10.68GDD47 pKa = 3.58LVPYY51 pKa = 10.04FIEE54 pKa = 5.67DD55 pKa = 3.52INIQKK60 pKa = 10.05QGNAIVALEE69 pKa = 4.37EE70 pKa = 4.22VNTMAKK76 pKa = 10.03AQALVGSSLYY86 pKa = 10.9LPLEE90 pKa = 4.43DD91 pKa = 5.47LEE93 pKa = 4.42EE94 pKa = 5.17LGGEE98 pKa = 3.65NFYY101 pKa = 10.99YY102 pKa = 10.64HH103 pKa = 7.36EE104 pKa = 4.52IKK106 pKa = 10.59GYY108 pKa = 7.4TVIDD112 pKa = 3.52QTAGEE117 pKa = 4.17LGIVRR122 pKa = 11.84EE123 pKa = 4.42VYY125 pKa = 10.6SLNGQDD131 pKa = 5.35LIAMDD136 pKa = 4.0YY137 pKa = 10.9EE138 pKa = 4.44GTEE141 pKa = 4.0VLIPTANEE149 pKa = 3.37IVQRR153 pKa = 11.84ADD155 pKa = 3.31KK156 pKa = 8.66EE157 pKa = 4.83TKK159 pKa = 9.76QLLVNLPEE167 pKa = 4.76GLLEE171 pKa = 4.34VYY173 pKa = 10.36LSKK176 pKa = 11.23DD177 pKa = 3.03SDD179 pKa = 4.09SEE181 pKa = 4.4NIPDD185 pKa = 5.14DD186 pKa = 4.21ADD188 pKa = 3.21
Molecular weight: 21.03 kDa
Isoelectric point according different methods:
Protein with the highest isoelectric point:
>tr|A0A0Q5T9I9|A0A0Q5T9I9_9BACT Peptidase_M56 domain-containing protein OS=Dyadobacter sp. Leaf189 OX=1736295 GN=ASG33_20130 PE=4 SV=1
MM1 pKa = 7.56FPILLIAHH9 pKa = 7.28SITRR13 pKa = 11.84WFVVTTLSIAIYY25 pKa = 9.92RR26 pKa = 11.84GIRR29 pKa = 11.84GWRR32 pKa = 11.84GAKK35 pKa = 9.76EE36 pKa = 3.72FTRR39 pKa = 11.84RR40 pKa = 11.84DD41 pKa = 3.09DD42 pKa = 3.8SLRR45 pKa = 11.84HH46 pKa = 4.41GTATFSHH53 pKa = 5.87IQMMIGYY60 pKa = 8.81LLYY63 pKa = 10.66FNSPFISYY71 pKa = 9.41FRR73 pKa = 11.84SHH75 pKa = 6.6FKK77 pKa = 10.5EE78 pKa = 4.73AIQHH82 pKa = 5.81FDD84 pKa = 3.3FVFFGILHH92 pKa = 5.7ITLMTIAVIIITIGSSAAKK111 pKa = 9.97RR112 pKa = 11.84QQTDD116 pKa = 3.19LAKK119 pKa = 10.41FRR121 pKa = 11.84IMTICFIVAAIIIFIAIPWPFSPLATRR148 pKa = 11.84PYY150 pKa = 11.05LRR152 pKa = 11.84IFF154 pKa = 3.68
MM1 pKa = 7.56FPILLIAHH9 pKa = 7.28SITRR13 pKa = 11.84WFVVTTLSIAIYY25 pKa = 9.92RR26 pKa = 11.84GIRR29 pKa = 11.84GWRR32 pKa = 11.84GAKK35 pKa = 9.76EE36 pKa = 3.72FTRR39 pKa = 11.84RR40 pKa = 11.84DD41 pKa = 3.09DD42 pKa = 3.8SLRR45 pKa = 11.84HH46 pKa = 4.41GTATFSHH53 pKa = 5.87IQMMIGYY60 pKa = 8.81LLYY63 pKa = 10.66FNSPFISYY71 pKa = 9.41FRR73 pKa = 11.84SHH75 pKa = 6.6FKK77 pKa = 10.5EE78 pKa = 4.73AIQHH82 pKa = 5.81FDD84 pKa = 3.3FVFFGILHH92 pKa = 5.7ITLMTIAVIIITIGSSAAKK111 pKa = 9.97RR112 pKa = 11.84QQTDD116 pKa = 3.19LAKK119 pKa = 10.41FRR121 pKa = 11.84IMTICFIVAAIIIFIAIPWPFSPLATRR148 pKa = 11.84PYY150 pKa = 11.05LRR152 pKa = 11.84IFF154 pKa = 3.68
Molecular weight: 17.88 kDa
Isoelectric point according different methods:
Peptides (in silico digests for buttom-up proteomics)
Below you can find in silico digests of the whole proteome with Trypsin, Chymotrypsin, Trypsin+LysC, LysN, ArgC proteases suitable for different mass spec machines.| Try ESI |
 |
|---|
| ChTry ESI |
 |
|---|
| ArgC ESI |
 |
|---|
| LysN ESI |
 |
|---|
| TryLysC ESI |
 |
|---|
| Try MALDI |
 |
|---|
| ChTry MALDI |
 |
|---|
| ArgC MALDI |
 |
|---|
| LysN MALDI |
 |
|---|
| TryLysC MALDI |
 |
|---|
| Try LTQ |
 |
|---|
| ChTry LTQ |
 |
|---|
| ArgC LTQ |
 |
|---|
| LysN LTQ |
 |
|---|
| TryLysC LTQ |
 |
|---|
| Try MSlow |
 |
|---|
| ChTry MSlow |
 |
|---|
| ArgC MSlow |
 |
|---|
| LysN MSlow |
 |
|---|
| TryLysC MSlow |
 |
|---|
| Try MShigh |
 |
|---|
| ChTry MShigh |
 |
|---|
| ArgC MShigh |
 |
|---|
| LysN MShigh |
 |
|---|
| TryLysC MShigh |
 |
|---|
General Statistics
Number of major isoforms |
Number of additional isoforms |
Number of all proteins |
Number of amino acids |
Min. Seq. Length |
Max. Seq. Length |
Avg. Seq. Length |
Avg. Mol. Weight |
|---|---|---|---|---|---|---|---|
0 |
1823744 |
55 |
2385 |
365.2 |
40.83 |
Amino acid frequency
Ala |
Cys |
Asp |
Glu |
Phe |
Gly |
His |
Ile |
Lys |
Leu |
|---|---|---|---|---|---|---|---|---|---|
7.902 ± 0.031 | 0.713 ± 0.01 |
5.282 ± 0.023 | 6.075 ± 0.03 |
4.92 ± 0.024 | 7.135 ± 0.034 |
1.821 ± 0.015 | 6.599 ± 0.029 |
6.282 ± 0.028 | 9.469 ± 0.038 |
Met |
Asn |
Gln |
Pro |
Arg |
Ser |
Thr |
Val |
Trp |
Tyr |
|---|---|---|---|---|---|---|---|---|---|
2.275 ± 0.013 | 5.093 ± 0.029 |
4.1 ± 0.02 | 3.771 ± 0.018 |
4.581 ± 0.021 | 6.545 ± 0.028 |
5.655 ± 0.028 | 6.645 ± 0.026 |
1.276 ± 0.012 | 3.861 ± 0.02 |
Most of the basic statistics you can see at this page can be downloaded from this CSV file
Proteome-pI is available under Creative Commons Attribution-NoDerivs license, for more details see here
| Reference: Kozlowski LP. Proteome-pI 2.0: Proteome Isoelectric Point Database Update. Nucleic Acids Res. 2021, doi: 10.1093/nar/gkab944 | Contact: Lukasz P. Kozlowski |
