Buchnera aphidicola (Cinara tujafilina)
Taxonomy: cellular organisms; Bacteria; Proteobacteria; Gammaproteobacteria; Enterobacterales; Erwiniaceae; Buchnera; Buchnera aphidicola
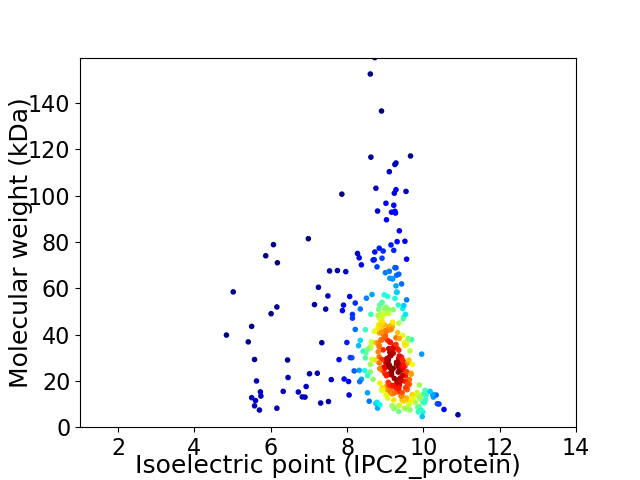
Average proteome isoelectric point is 8.65
Get precalculated fractions of proteins

Virtual 2D-PAGE plot for 359 proteins (isoelectric point calculated using IPC2_protein)
Get csv file with sequences according to given criteria:
* You can choose from 21 different methods for calculating isoelectric point
Summary statistics related to proteome-wise predictions


Protein with the lowest isoelectric point:
>tr|F7WZ75|F7WZ75_9GAMM ATP-binding cell division protein OS=Buchnera aphidicola (Cinara tujafilina) OX=261317 GN=ftsA PE=4 SV=1
MM1 pKa = 7.52FEE3 pKa = 4.43PVNLEE8 pKa = 3.17NDD10 pKa = 4.22AIIKK14 pKa = 9.74VIGIGGGGSNAVEE27 pKa = 3.65HH28 pKa = 6.7MIRR31 pKa = 11.84EE32 pKa = 4.32KK33 pKa = 10.73IEE35 pKa = 3.84GVEE38 pKa = 4.14FFAINTDD45 pKa = 3.23AQALRR50 pKa = 11.84KK51 pKa = 9.14IDD53 pKa = 3.51VGQTIQIGNNITKK66 pKa = 10.6GLGAGANPEE75 pKa = 4.15VGRR78 pKa = 11.84TAAEE82 pKa = 3.86EE83 pKa = 3.79DD84 pKa = 3.8TEE86 pKa = 4.22RR87 pKa = 11.84LKK89 pKa = 11.19SALEE93 pKa = 4.07GADD96 pKa = 3.66MIFIAAGMGGGTGTGATPIIAKK118 pKa = 9.68IARR121 pKa = 11.84DD122 pKa = 3.73LGILTVAVVTKK133 pKa = 10.06PFSFEE138 pKa = 3.59GKK140 pKa = 9.81KK141 pKa = 10.53RR142 pKa = 11.84MIYY145 pKa = 10.4AEE147 pKa = 4.05QGLQEE152 pKa = 4.27LSKK155 pKa = 11.2SVDD158 pKa = 3.45SLITIPNDD166 pKa = 3.11KK167 pKa = 10.19LLKK170 pKa = 9.37VLSRR174 pKa = 11.84GISLLDD180 pKa = 3.39AFKK183 pKa = 10.75AANDD187 pKa = 3.61ILKK190 pKa = 10.68GAVQGIAEE198 pKa = 5.59LITRR202 pKa = 11.84PGLMNVDD209 pKa = 4.24FADD212 pKa = 3.24VRR214 pKa = 11.84TVMSEE219 pKa = 3.25MGYY222 pKa = 11.54AMMGTGSASGEE233 pKa = 3.9NRR235 pKa = 11.84AEE237 pKa = 4.07EE238 pKa = 4.11ASEE241 pKa = 3.91IAISSPLLEE250 pKa = 6.07DD251 pKa = 3.85IDD253 pKa = 4.68LSGTKK258 pKa = 10.14GVLVNITAGFDD269 pKa = 3.28LRR271 pKa = 11.84LDD273 pKa = 3.57EE274 pKa = 5.7FEE276 pKa = 4.61TVGNTIRR283 pKa = 11.84AFSSDD288 pKa = 3.06NATVVIGTSLDD299 pKa = 3.48PKK301 pKa = 9.77MEE303 pKa = 3.95EE304 pKa = 4.05SLRR307 pKa = 11.84VTVVATGIGGDD318 pKa = 3.37KK319 pKa = 10.74HH320 pKa = 8.19SDD322 pKa = 2.72IMLMNNRR329 pKa = 11.84SSKK332 pKa = 11.37DD333 pKa = 3.22MLLGYY338 pKa = 8.52QNKK341 pKa = 10.1LSLNQNDD348 pKa = 4.01TNNTYY353 pKa = 10.65SEE355 pKa = 4.15NKK357 pKa = 9.18MKK359 pKa = 10.54EE360 pKa = 4.04KK361 pKa = 10.79NITPNNQNEE370 pKa = 4.51KK371 pKa = 10.45IFF373 pKa = 3.86
MM1 pKa = 7.52FEE3 pKa = 4.43PVNLEE8 pKa = 3.17NDD10 pKa = 4.22AIIKK14 pKa = 9.74VIGIGGGGSNAVEE27 pKa = 3.65HH28 pKa = 6.7MIRR31 pKa = 11.84EE32 pKa = 4.32KK33 pKa = 10.73IEE35 pKa = 3.84GVEE38 pKa = 4.14FFAINTDD45 pKa = 3.23AQALRR50 pKa = 11.84KK51 pKa = 9.14IDD53 pKa = 3.51VGQTIQIGNNITKK66 pKa = 10.6GLGAGANPEE75 pKa = 4.15VGRR78 pKa = 11.84TAAEE82 pKa = 3.86EE83 pKa = 3.79DD84 pKa = 3.8TEE86 pKa = 4.22RR87 pKa = 11.84LKK89 pKa = 11.19SALEE93 pKa = 4.07GADD96 pKa = 3.66MIFIAAGMGGGTGTGATPIIAKK118 pKa = 9.68IARR121 pKa = 11.84DD122 pKa = 3.73LGILTVAVVTKK133 pKa = 10.06PFSFEE138 pKa = 3.59GKK140 pKa = 9.81KK141 pKa = 10.53RR142 pKa = 11.84MIYY145 pKa = 10.4AEE147 pKa = 4.05QGLQEE152 pKa = 4.27LSKK155 pKa = 11.2SVDD158 pKa = 3.45SLITIPNDD166 pKa = 3.11KK167 pKa = 10.19LLKK170 pKa = 9.37VLSRR174 pKa = 11.84GISLLDD180 pKa = 3.39AFKK183 pKa = 10.75AANDD187 pKa = 3.61ILKK190 pKa = 10.68GAVQGIAEE198 pKa = 5.59LITRR202 pKa = 11.84PGLMNVDD209 pKa = 4.24FADD212 pKa = 3.24VRR214 pKa = 11.84TVMSEE219 pKa = 3.25MGYY222 pKa = 11.54AMMGTGSASGEE233 pKa = 3.9NRR235 pKa = 11.84AEE237 pKa = 4.07EE238 pKa = 4.11ASEE241 pKa = 3.91IAISSPLLEE250 pKa = 6.07DD251 pKa = 3.85IDD253 pKa = 4.68LSGTKK258 pKa = 10.14GVLVNITAGFDD269 pKa = 3.28LRR271 pKa = 11.84LDD273 pKa = 3.57EE274 pKa = 5.7FEE276 pKa = 4.61TVGNTIRR283 pKa = 11.84AFSSDD288 pKa = 3.06NATVVIGTSLDD299 pKa = 3.48PKK301 pKa = 9.77MEE303 pKa = 3.95EE304 pKa = 4.05SLRR307 pKa = 11.84VTVVATGIGGDD318 pKa = 3.37KK319 pKa = 10.74HH320 pKa = 8.19SDD322 pKa = 2.72IMLMNNRR329 pKa = 11.84SSKK332 pKa = 11.37DD333 pKa = 3.22MLLGYY338 pKa = 8.52QNKK341 pKa = 10.1LSLNQNDD348 pKa = 4.01TNNTYY353 pKa = 10.65SEE355 pKa = 4.15NKK357 pKa = 9.18MKK359 pKa = 10.54EE360 pKa = 4.04KK361 pKa = 10.79NITPNNQNEE370 pKa = 4.51KK371 pKa = 10.45IFF373 pKa = 3.86
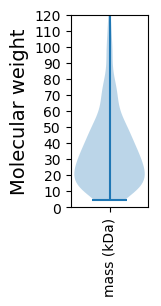
Molecular weight: 39.78 kDa
Isoelectric point according different methods:
Protein with the highest isoelectric point:
>tr|F7WYV9|F7WYV9_9GAMM 10 kDa chaperonin OS=Buchnera aphidicola (Cinara tujafilina) OX=261317 GN=groS PE=3 SV=1
MM1 pKa = 7.45KK2 pKa = 9.59RR3 pKa = 11.84TFQPSKK9 pKa = 9.24IKK11 pKa = 10.37RR12 pKa = 11.84ARR14 pKa = 11.84THH16 pKa = 5.9GFRR19 pKa = 11.84TRR21 pKa = 11.84MSTKK25 pKa = 9.67NGRR28 pKa = 11.84HH29 pKa = 4.79ILSRR33 pKa = 11.84RR34 pKa = 11.84RR35 pKa = 11.84IKK37 pKa = 10.76SRR39 pKa = 11.84IRR41 pKa = 11.84LCVV44 pKa = 2.96
MM1 pKa = 7.45KK2 pKa = 9.59RR3 pKa = 11.84TFQPSKK9 pKa = 9.24IKK11 pKa = 10.37RR12 pKa = 11.84ARR14 pKa = 11.84THH16 pKa = 5.9GFRR19 pKa = 11.84TRR21 pKa = 11.84MSTKK25 pKa = 9.67NGRR28 pKa = 11.84HH29 pKa = 4.79ILSRR33 pKa = 11.84RR34 pKa = 11.84RR35 pKa = 11.84IKK37 pKa = 10.76SRR39 pKa = 11.84IRR41 pKa = 11.84LCVV44 pKa = 2.96
Molecular weight: 5.37 kDa
Isoelectric point according different methods:
Peptides (in silico digests for buttom-up proteomics)
Below you can find in silico digests of the whole proteome with Trypsin, Chymotrypsin, Trypsin+LysC, LysN, ArgC proteases suitable for different mass spec machines.| Try ESI |
 |
|---|
| ChTry ESI |
 |
|---|
| ArgC ESI |
 |
|---|
| LysN ESI |
 |
|---|
| TryLysC ESI |
 |
|---|
| Try MALDI |
 |
|---|
| ChTry MALDI |
 |
|---|
| ArgC MALDI |
 |
|---|
| LysN MALDI |
 |
|---|
| TryLysC MALDI |
 |
|---|
| Try LTQ |
 |
|---|
| ChTry LTQ |
 |
|---|
| ArgC LTQ |
 |
|---|
| LysN LTQ |
 |
|---|
| TryLysC LTQ |
 |
|---|
| Try MSlow |
 |
|---|
| ChTry MSlow |
 |
|---|
| ArgC MSlow |
 |
|---|
| LysN MSlow |
 |
|---|
| TryLysC MSlow |
 |
|---|
| Try MShigh |
 |
|---|
| ChTry MShigh |
 |
|---|
| ArgC MShigh |
 |
|---|
| LysN MShigh |
 |
|---|
| TryLysC MShigh |
 |
|---|
General Statistics
Number of major isoforms |
Number of additional isoforms |
Number of all proteins |
Number of amino acids |
Min. Seq. Length |
Max. Seq. Length |
Avg. Seq. Length |
Avg. Mol. Weight |
|---|---|---|---|---|---|---|---|
0 |
115088 |
38 |
1420 |
320.6 |
36.9 |
Amino acid frequency
Ala |
Cys |
Asp |
Glu |
Phe |
Gly |
His |
Ile |
Lys |
Leu |
|---|---|---|---|---|---|---|---|---|---|
3.909 ± 0.107 | 1.372 ± 0.048 |
3.917 ± 0.086 | 4.305 ± 0.125 |
5.3 ± 0.152 | 5.182 ± 0.123 |
2.178 ± 0.044 | 12.742 ± 0.163 |
10.82 ± 0.199 | 10.052 ± 0.113 |
Met |
Asn |
Gln |
Pro |
Arg |
Ser |
Thr |
Val |
Trp |
Tyr |
|---|---|---|---|---|---|---|---|---|---|
2.124 ± 0.045 | 7.622 ± 0.131 |
2.964 ± 0.054 | 3.244 ± 0.053 |
3.559 ± 0.096 | 6.666 ± 0.085 |
4.546 ± 0.07 | 4.333 ± 0.094 |
0.852 ± 0.044 | 4.311 ± 0.099 |
Most of the basic statistics you can see at this page can be downloaded from this CSV file
Proteome-pI is available under Creative Commons Attribution-NoDerivs license, for more details see here
| Reference: Kozlowski LP. Proteome-pI 2.0: Proteome Isoelectric Point Database Update. Nucleic Acids Res. 2021, doi: 10.1093/nar/gkab944 | Contact: Lukasz P. Kozlowski |
