Agrobacterium fabrum (strain C58 / ATCC 33970) (Agrobacterium tumefaciens (strain C58))
Taxonomy: cellular organisms; Bacteria; Proteobacteria; Alphaproteobacteria; Hyphomicrobiales; Rhizobiaceae; Rhizobium/Agrobacterium group; Agrobacterium; Agrobacterium tumefaciens complex; Agrobacterium fabrum
Average proteome isoelectric point is 6.54
Get precalculated fractions of proteins
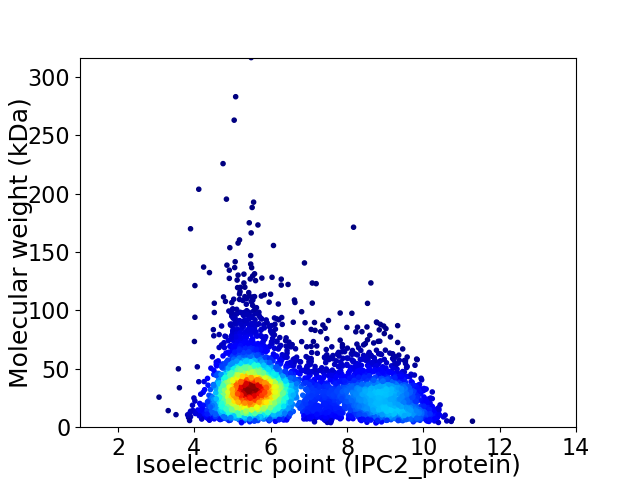
Virtual 2D-PAGE plot for 5344 proteins (isoelectric point calculated using IPC2_protein)
Get csv file with sequences according to given criteria:
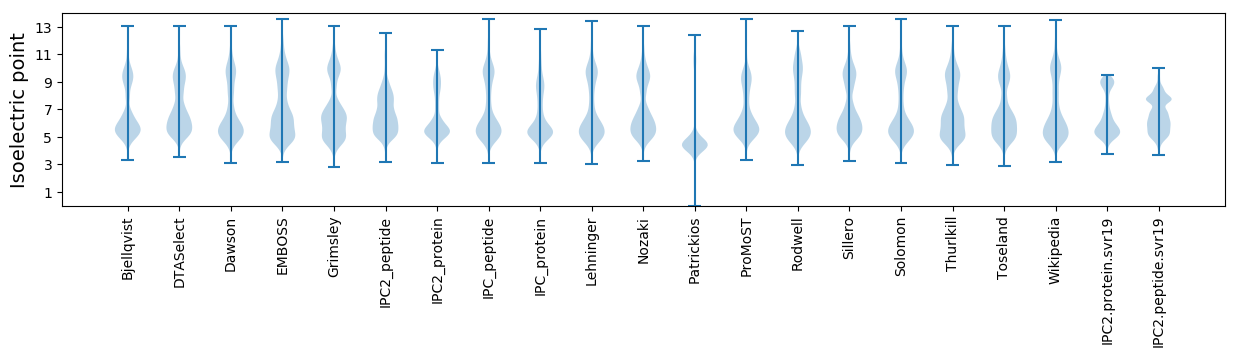
* You can choose from 21 different methods for calculating isoelectric point
Summary statistics related to proteome-wise predictions
Protein with the lowest isoelectric point:
>tr|Q7CXS1|Q7CXS1_AGRFC Uncharacterized protein OS=Agrobacterium fabrum (strain C58 / ATCC 33970) OX=176299 GN=Atu2146 PE=4 SV=2
MM1 pKa = 7.05KK2 pKa = 9.67TLIVTSLLALSASTAMAADD21 pKa = 3.7AVYY24 pKa = 7.47EE25 pKa = 4.53TPAPPVAQEE34 pKa = 4.02TLPVFTWSGPYY45 pKa = 10.34LGIQGGAGWANGDD58 pKa = 4.05FSAGGPVVSDD68 pKa = 4.23DD69 pKa = 3.92FNGGILGAFAGYY81 pKa = 10.56NYY83 pKa = 10.18QFDD86 pKa = 4.31NNMVLGIEE94 pKa = 4.47GDD96 pKa = 3.56VDD98 pKa = 4.49YY99 pKa = 11.53NWNDD103 pKa = 3.04NDD105 pKa = 3.54YY106 pKa = 11.35SGIKK110 pKa = 10.23VGTDD114 pKa = 2.83WQGSVRR120 pKa = 11.84GRR122 pKa = 11.84VGYY125 pKa = 10.8AFDD128 pKa = 3.93HH129 pKa = 6.09ALIYY133 pKa = 9.3ATAGWTATRR142 pKa = 11.84GFIEE146 pKa = 4.74TPVGDD151 pKa = 5.17DD152 pKa = 2.85KK153 pKa = 11.72ATFNGYY159 pKa = 7.0TVGAGVDD166 pKa = 3.5YY167 pKa = 11.31AFTDD171 pKa = 3.55NVFGRR176 pKa = 11.84LEE178 pKa = 3.82YY179 pKa = 10.33RR180 pKa = 11.84YY181 pKa = 10.46NDD183 pKa = 3.79YY184 pKa = 11.23GDD186 pKa = 3.93KK187 pKa = 10.89DD188 pKa = 3.33IFGINTDD195 pKa = 4.43FDD197 pKa = 3.52QHH199 pKa = 4.79TVKK202 pKa = 10.85VGLGVKK208 pKa = 9.56FF209 pKa = 3.72
MM1 pKa = 7.05KK2 pKa = 9.67TLIVTSLLALSASTAMAADD21 pKa = 3.7AVYY24 pKa = 7.47EE25 pKa = 4.53TPAPPVAQEE34 pKa = 4.02TLPVFTWSGPYY45 pKa = 10.34LGIQGGAGWANGDD58 pKa = 4.05FSAGGPVVSDD68 pKa = 4.23DD69 pKa = 3.92FNGGILGAFAGYY81 pKa = 10.56NYY83 pKa = 10.18QFDD86 pKa = 4.31NNMVLGIEE94 pKa = 4.47GDD96 pKa = 3.56VDD98 pKa = 4.49YY99 pKa = 11.53NWNDD103 pKa = 3.04NDD105 pKa = 3.54YY106 pKa = 11.35SGIKK110 pKa = 10.23VGTDD114 pKa = 2.83WQGSVRR120 pKa = 11.84GRR122 pKa = 11.84VGYY125 pKa = 10.8AFDD128 pKa = 3.93HH129 pKa = 6.09ALIYY133 pKa = 9.3ATAGWTATRR142 pKa = 11.84GFIEE146 pKa = 4.74TPVGDD151 pKa = 5.17DD152 pKa = 2.85KK153 pKa = 11.72ATFNGYY159 pKa = 7.0TVGAGVDD166 pKa = 3.5YY167 pKa = 11.31AFTDD171 pKa = 3.55NVFGRR176 pKa = 11.84LEE178 pKa = 3.82YY179 pKa = 10.33RR180 pKa = 11.84YY181 pKa = 10.46NDD183 pKa = 3.79YY184 pKa = 11.23GDD186 pKa = 3.93KK187 pKa = 10.89DD188 pKa = 3.33IFGINTDD195 pKa = 4.43FDD197 pKa = 3.52QHH199 pKa = 4.79TVKK202 pKa = 10.85VGLGVKK208 pKa = 9.56FF209 pKa = 3.72
Molecular weight: 22.4 kDa
Isoelectric point according different methods:
Protein with the highest isoelectric point:
>sp|Q44452|TRAM_AGRFC Transcriptional repressor TraM OS=Agrobacterium fabrum (strain C58 / ATCC 33970) OX=176299 GN=traM PE=4 SV=1
MM1 pKa = 7.69SKK3 pKa = 9.01RR4 pKa = 11.84TFQPSKK10 pKa = 9.84LVRR13 pKa = 11.84KK14 pKa = 9.15RR15 pKa = 11.84RR16 pKa = 11.84HH17 pKa = 4.42GFRR20 pKa = 11.84ARR22 pKa = 11.84MATAGGRR29 pKa = 11.84KK30 pKa = 8.88VLAARR35 pKa = 11.84RR36 pKa = 11.84ARR38 pKa = 11.84GRR40 pKa = 11.84ARR42 pKa = 11.84LSAA45 pKa = 3.99
MM1 pKa = 7.69SKK3 pKa = 9.01RR4 pKa = 11.84TFQPSKK10 pKa = 9.84LVRR13 pKa = 11.84KK14 pKa = 9.15RR15 pKa = 11.84RR16 pKa = 11.84HH17 pKa = 4.42GFRR20 pKa = 11.84ARR22 pKa = 11.84MATAGGRR29 pKa = 11.84KK30 pKa = 8.88VLAARR35 pKa = 11.84RR36 pKa = 11.84ARR38 pKa = 11.84GRR40 pKa = 11.84ARR42 pKa = 11.84LSAA45 pKa = 3.99
Molecular weight: 5.12 kDa
Isoelectric point according different methods:
Peptides (in silico digests for buttom-up proteomics)
Below you can find in silico digests of the whole proteome with Trypsin, Chymotrypsin, Trypsin+LysC, LysN, ArgC proteases suitable for different mass spec machines.| Try ESI |
 |
|---|
| ChTry ESI |
|
|---|
| ArgC ESI |
|
|---|
| LysN ESI |
|
|---|
| TryLysC ESI |
|
|---|
| Try MALDI |
|
|---|
| ChTry MALDI |
|
|---|
| ArgC MALDI |
|
|---|
| LysN MALDI |
|
|---|
| TryLysC MALDI |
|
|---|
| Try LTQ |
|
|---|
| ChTry LTQ |
|
|---|
| ArgC LTQ |
|
|---|
| LysN LTQ |
|
|---|
| TryLysC LTQ |
|
|---|
| Try MSlow |
|
|---|
| ChTry MSlow |
|
|---|
| ArgC MSlow |
|
|---|
| LysN MSlow |
|
|---|
| TryLysC MSlow |
|
|---|
| Try MShigh |
|
|---|
| ChTry MShigh |
|
|---|
| ArgC MShigh |
|
|---|
| LysN MShigh |
|
|---|
| TryLysC MShigh |
|
|---|
General Statistics
Number of major isoforms |
Number of additional isoforms |
Number of all proteins |
Number of amino acids |
Min. Seq. Length |
Max. Seq. Length |
Avg. Seq. Length |
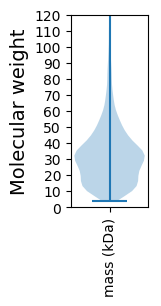
Avg. Mol. Weight |
|---|---|---|---|---|---|---|---|
0 |
1660809 |
33 |
2831 |
310.8 |
33.87 |
Amino acid frequency
Ala |
Cys |
Asp |
Glu |
Phe |
Gly |
His |
Ile |
Lys |
Leu |
|---|---|---|---|---|---|---|---|---|---|
11.572 ± 0.046 | 0.798 ± 0.01 |
5.589 ± 0.026 | 5.816 ± 0.031 |
4.053 ± 0.023 | 8.266 ± 0.033 |
2.01 ± 0.015 | 5.797 ± 0.028 |
3.892 ± 0.03 | 9.925 ± 0.037 |
Met |
Asn |
Gln |
Pro |
Arg |
Ser |
Thr |
Val |
Trp |
Tyr |
|---|---|---|---|---|---|---|---|---|---|
2.6 ± 0.015 | 2.986 ± 0.018 |
4.782 ± 0.023 | 3.125 ± 0.02 |
6.564 ± 0.032 | 5.946 ± 0.024 |
5.375 ± 0.022 | 7.338 ± 0.026 |
1.252 ± 0.013 | 2.313 ± 0.016 |
Most of the basic statistics you can see at this page can be downloaded from this CSV file
See this proteome in:

Proteome-pI is available under Creative Commons Attribution-NoDerivs license, for more details see here
| Reference: Kozlowski LP. Proteome-pI 2.0: Proteome Isoelectric Point Database Update. Nucleic Acids Res. 2021, doi: 10.1093/nar/gkab944 | Contact: Lukasz P. Kozlowski |