Heterocephalus glaber (Naked mole rat)
Taxonomy: cellular organisms; Eukaryota; Opisthokonta; Metazoa; Eumetazoa; Bilateria; Deuterostomia; Chordata; Craniata; Vertebrata; Gnathostomata; Teleostomi; Euteleostomi; Sarcopterygii; Dipnotetrapodomorpha; Tetrapoda; Amniota; Mammalia; Theria; Eutheria; Boreoeutheria; Euarchontoglires; Glires;
Average proteome isoelectric point is 6.69
Get precalculated fractions of proteins

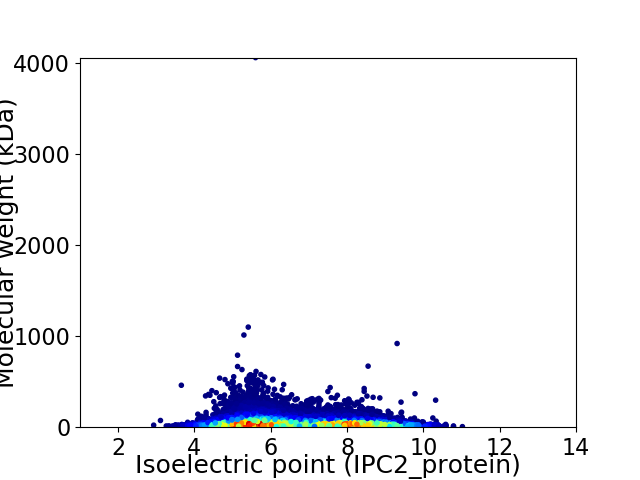
Virtual 2D-PAGE plot for 21449 proteins (isoelectric point calculated using IPC2_protein)
Get csv file with sequences according to given criteria:
* You can choose from 21 different methods for calculating isoelectric point
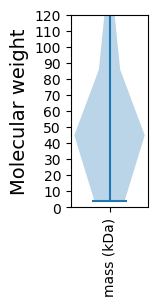
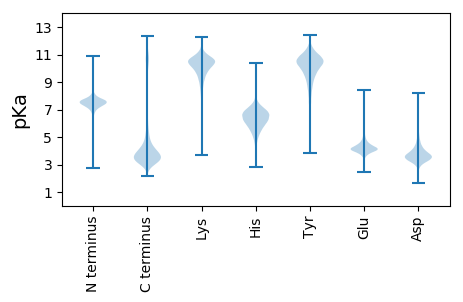
Summary statistics related to proteome-wise predictions


Protein with the lowest isoelectric point:
>tr|G5AUA9|G5AUA9_HETGA LON peptidase and RING finger protein 1 OS=Heterocephalus glaber OX=10181 GN=GW7_13438 PE=4 SV=1
MM1 pKa = 7.86PNQSAADD8 pKa = 4.03RR9 pKa = 11.84QVCARR14 pKa = 11.84PTEE17 pKa = 4.25VSSPTEE23 pKa = 3.8HH24 pKa = 6.45TEE26 pKa = 3.86SARR29 pKa = 11.84ALATIHH35 pKa = 5.69WTPIPAPLYY44 pKa = 8.76SHH46 pKa = 7.15LVLHH50 pKa = 6.01YY51 pKa = 10.66KK52 pKa = 8.4EE53 pKa = 4.97TEE55 pKa = 4.12DD56 pKa = 4.82TGPPDD61 pKa = 3.59NGTEE65 pKa = 4.22SSGSLLRR72 pKa = 11.84DD73 pKa = 3.8PEE75 pKa = 5.77DD76 pKa = 4.22EE77 pKa = 5.86DD78 pKa = 4.44SDD80 pKa = 5.11GYY82 pKa = 11.21DD83 pKa = 3.22GEE85 pKa = 4.53EE86 pKa = 4.33YY87 pKa = 10.51DD88 pKa = 5.49VEE90 pKa = 4.24AHH92 pKa = 5.97EE93 pKa = 4.68QGQGDD98 pKa = 3.55IPKK101 pKa = 9.87FYY103 pKa = 9.91TYY105 pKa = 10.99EE106 pKa = 4.02EE107 pKa = 4.41GLSYY111 pKa = 9.92LTAEE115 pKa = 4.55GQDD118 pKa = 3.74TLEE121 pKa = 4.56MLPQSVSSQYY131 pKa = 11.78NMAGVQTEE139 pKa = 4.1DD140 pKa = 3.07SVRR143 pKa = 11.84DD144 pKa = 3.75YY145 pKa = 10.86EE146 pKa = 5.55DD147 pKa = 3.45SMEE150 pKa = 4.08VDD152 pKa = 3.52TTPGVARR159 pKa = 11.84QFEE162 pKa = 4.44DD163 pKa = 4.42ADD165 pKa = 3.59IDD167 pKa = 3.93HH168 pKa = 7.16
MM1 pKa = 7.86PNQSAADD8 pKa = 4.03RR9 pKa = 11.84QVCARR14 pKa = 11.84PTEE17 pKa = 4.25VSSPTEE23 pKa = 3.8HH24 pKa = 6.45TEE26 pKa = 3.86SARR29 pKa = 11.84ALATIHH35 pKa = 5.69WTPIPAPLYY44 pKa = 8.76SHH46 pKa = 7.15LVLHH50 pKa = 6.01YY51 pKa = 10.66KK52 pKa = 8.4EE53 pKa = 4.97TEE55 pKa = 4.12DD56 pKa = 4.82TGPPDD61 pKa = 3.59NGTEE65 pKa = 4.22SSGSLLRR72 pKa = 11.84DD73 pKa = 3.8PEE75 pKa = 5.77DD76 pKa = 4.22EE77 pKa = 5.86DD78 pKa = 4.44SDD80 pKa = 5.11GYY82 pKa = 11.21DD83 pKa = 3.22GEE85 pKa = 4.53EE86 pKa = 4.33YY87 pKa = 10.51DD88 pKa = 5.49VEE90 pKa = 4.24AHH92 pKa = 5.97EE93 pKa = 4.68QGQGDD98 pKa = 3.55IPKK101 pKa = 9.87FYY103 pKa = 9.91TYY105 pKa = 10.99EE106 pKa = 4.02EE107 pKa = 4.41GLSYY111 pKa = 9.92LTAEE115 pKa = 4.55GQDD118 pKa = 3.74TLEE121 pKa = 4.56MLPQSVSSQYY131 pKa = 11.78NMAGVQTEE139 pKa = 4.1DD140 pKa = 3.07SVRR143 pKa = 11.84DD144 pKa = 3.75YY145 pKa = 10.86EE146 pKa = 5.55DD147 pKa = 3.45SMEE150 pKa = 4.08VDD152 pKa = 3.52TTPGVARR159 pKa = 11.84QFEE162 pKa = 4.44DD163 pKa = 4.42ADD165 pKa = 3.59IDD167 pKa = 3.93HH168 pKa = 7.16
Molecular weight: 18.6 kDa
Isoelectric point according different methods:
Protein with the highest isoelectric point:
>tr|G5BBX4|G5BBX4_HETGA G-protein coupled receptor 98 OS=Heterocephalus glaber OX=10181 GN=GW7_06052 PE=4 SV=1
MM1 pKa = 7.78APPSVPQPVLFCDD14 pKa = 4.57LPVCFQVAKK23 pKa = 9.93KK24 pKa = 10.13SSRR27 pKa = 11.84ARR29 pKa = 11.84RR30 pKa = 11.84PGPRR34 pKa = 11.84TGKK37 pKa = 10.14KK38 pKa = 9.66LSPRR42 pKa = 11.84ASPRR46 pKa = 11.84PPRR49 pKa = 11.84DD50 pKa = 3.06RR51 pKa = 11.84RR52 pKa = 11.84RR53 pKa = 11.84KK54 pKa = 7.52PQQGLAVLSTNRR66 pKa = 11.84GSSPSKK72 pKa = 9.46MRR74 pKa = 11.84QGSSRR79 pKa = 11.84ALGARR84 pKa = 11.84KK85 pKa = 9.21RR86 pKa = 11.84CTRR89 pKa = 11.84RR90 pKa = 11.84GPKK93 pKa = 9.74RR94 pKa = 11.84SPAKK98 pKa = 10.17LGRR101 pKa = 11.84NRR103 pKa = 11.84STRR106 pKa = 11.84GRR108 pKa = 11.84SRR110 pKa = 11.84GRR112 pKa = 11.84RR113 pKa = 11.84APASRR118 pKa = 11.84KK119 pKa = 6.87TMPMRR124 pKa = 4.36
MM1 pKa = 7.78APPSVPQPVLFCDD14 pKa = 4.57LPVCFQVAKK23 pKa = 9.93KK24 pKa = 10.13SSRR27 pKa = 11.84ARR29 pKa = 11.84RR30 pKa = 11.84PGPRR34 pKa = 11.84TGKK37 pKa = 10.14KK38 pKa = 9.66LSPRR42 pKa = 11.84ASPRR46 pKa = 11.84PPRR49 pKa = 11.84DD50 pKa = 3.06RR51 pKa = 11.84RR52 pKa = 11.84RR53 pKa = 11.84KK54 pKa = 7.52PQQGLAVLSTNRR66 pKa = 11.84GSSPSKK72 pKa = 9.46MRR74 pKa = 11.84QGSSRR79 pKa = 11.84ALGARR84 pKa = 11.84KK85 pKa = 9.21RR86 pKa = 11.84CTRR89 pKa = 11.84RR90 pKa = 11.84GPKK93 pKa = 9.74RR94 pKa = 11.84SPAKK98 pKa = 10.17LGRR101 pKa = 11.84NRR103 pKa = 11.84STRR106 pKa = 11.84GRR108 pKa = 11.84SRR110 pKa = 11.84GRR112 pKa = 11.84RR113 pKa = 11.84APASRR118 pKa = 11.84KK119 pKa = 6.87TMPMRR124 pKa = 4.36
Molecular weight: 13.78 kDa
Isoelectric point according different methods:
Peptides (in silico digests for buttom-up proteomics)
Below you can find in silico digests of the whole proteome with Trypsin, Chymotrypsin, Trypsin+LysC, LysN, ArgC proteases suitable for different mass spec machines.| Try ESI |
 |
|---|
| ChTry ESI |
 |
|---|
| ArgC ESI |
 |
|---|
| LysN ESI |
 |
|---|
| TryLysC ESI |
 |
|---|
| Try MALDI |
 |
|---|
| ChTry MALDI |
 |
|---|
| ArgC MALDI |
 |
|---|
| LysN MALDI |
 |
|---|
| TryLysC MALDI |
 |
|---|
| Try LTQ |
 |
|---|
| ChTry LTQ |
 |
|---|
| ArgC LTQ |
 |
|---|
| LysN LTQ |
 |
|---|
| TryLysC LTQ |
 |
|---|
| Try MSlow |
 |
|---|
| ChTry MSlow |
 |
|---|
| ArgC MSlow |
 |
|---|
| LysN MSlow |
 |
|---|
| TryLysC MSlow |
 |
|---|
| Try MShigh |
 |
|---|
| ChTry MShigh |
 |
|---|
| ArgC MShigh |
 |
|---|
| LysN MShigh |
 |
|---|
| TryLysC MShigh |
 |
|---|
General Statistics
Number of major isoforms |
Number of additional isoforms |
Number of all proteins |
Number of amino acids |
Min. Seq. Length |
Max. Seq. Length |
Avg. Seq. Length |
Avg. Mol. Weight |
|---|---|---|---|---|---|---|---|
10466552 |
37 |
36507 |
488.0 |
54.32 |
Amino acid frequency
Ala |
Cys |
Asp |
Glu |
Phe |
Gly |
His |
Ile |
Lys |
Leu |
|---|---|---|---|---|---|---|---|---|---|
6.913 ± 0.017 | 2.309 ± 0.016 |
4.766 ± 0.012 | 7.028 ± 0.025 |
3.734 ± 0.015 | 6.461 ± 0.022 |
2.666 ± 0.013 | 4.402 ± 0.016 |
5.728 ± 0.021 | 10.107 ± 0.025 |
Met |
Asn |
Gln |
Pro |
Arg |
Ser |
Thr |
Val |
Trp |
Tyr |
|---|---|---|---|---|---|---|---|---|---|
2.21 ± 0.009 | 3.539 ± 0.023 |
6.082 ± 0.025 | 4.751 ± 0.018 |
5.489 ± 0.016 | 8.239 ± 0.022 |
5.311 ± 0.014 | 6.155 ± 0.015 |
1.226 ± 0.006 | 2.688 ± 0.01 |
Most of the basic statistics you can see at this page can be downloaded from this CSV file
Proteome-pI is available under Creative Commons Attribution-NoDerivs license, for more details see here
| Reference: Kozlowski LP. Proteome-pI 2.0: Proteome Isoelectric Point Database Update. Nucleic Acids Res. 2021, doi: 10.1093/nar/gkab944 | Contact: Lukasz P. Kozlowski |
