Sulfolobus virus Kamchatka 1
Taxonomy: Viruses; Fuselloviridae; Alphafusellovirus; Sulfolobus spindle-shaped virus 9
Average proteome isoelectric point is 7.48
Get precalculated fractions of proteins

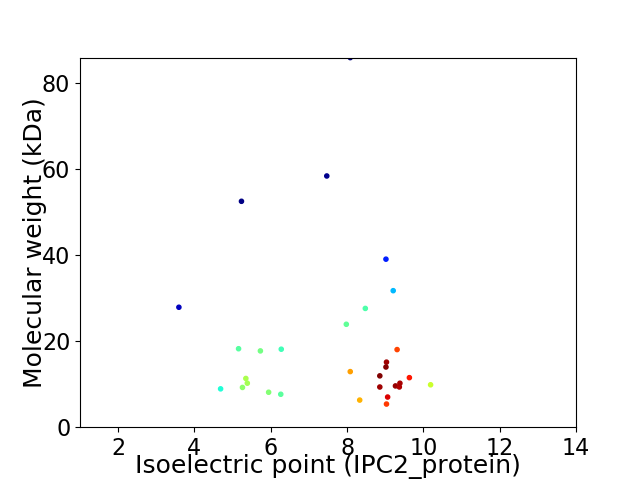
Virtual 2D-PAGE plot for 31 proteins (isoelectric point calculated using IPC2_protein)
Get csv file with sequences according to given criteria:
* You can choose from 21 different methods for calculating isoelectric point
Summary statistics related to proteome-wise predictions


Protein with the lowest isoelectric point:
>tr|Q6TDL3|Q6TDL3_9VIRU ORF B111 OS=Sulfolobus virus Kamchatka 1 OX=248496 PE=4 SV=1
MM1 pKa = 7.8PNYY4 pKa = 10.27LQTSNGYY11 pKa = 9.82LLFVLTASVEE21 pKa = 4.09ANEE24 pKa = 4.24YY25 pKa = 11.11SNGIYY30 pKa = 10.5LGTTYY35 pKa = 11.24LFLQITLDD43 pKa = 3.92FVNSANTYY51 pKa = 9.91EE52 pKa = 4.07ITAQVWTYY60 pKa = 9.6TGTLISYY67 pKa = 8.23TEE69 pKa = 4.21TPITLYY75 pKa = 10.53PNGEE79 pKa = 3.97AFMTLLYY86 pKa = 10.6NYY88 pKa = 10.41NNGNVATGALQEE100 pKa = 4.37GSTVIDD106 pKa = 3.78VYY108 pKa = 11.21FPTSYY113 pKa = 10.73SYY115 pKa = 11.85NSVTYY120 pKa = 10.63NVINTYY126 pKa = 10.86GFTDD130 pKa = 4.01PSGANPSFAIEE141 pKa = 4.12GTYY144 pKa = 9.56TGQPPFSDD152 pKa = 3.8TGWDD156 pKa = 3.84GMWINGAPEE165 pKa = 5.0PINAVAGHH173 pKa = 6.49SSTTDD178 pKa = 3.07VGGTAPIPSYY188 pKa = 10.29YY189 pKa = 10.45AEE191 pKa = 4.38SGLTLFHH198 pKa = 6.8NVFINYY204 pKa = 7.91WYY206 pKa = 10.81NPYY209 pKa = 10.73AWYY212 pKa = 9.73FSIGTPQDD220 pKa = 3.63YY221 pKa = 10.35SAHH224 pKa = 5.72GLNYY228 pKa = 9.25VQLSEE233 pKa = 4.1GQSYY237 pKa = 7.68NTINGLNYY245 pKa = 9.71ALYY248 pKa = 9.55WISPP252 pKa = 3.82
MM1 pKa = 7.8PNYY4 pKa = 10.27LQTSNGYY11 pKa = 9.82LLFVLTASVEE21 pKa = 4.09ANEE24 pKa = 4.24YY25 pKa = 11.11SNGIYY30 pKa = 10.5LGTTYY35 pKa = 11.24LFLQITLDD43 pKa = 3.92FVNSANTYY51 pKa = 9.91EE52 pKa = 4.07ITAQVWTYY60 pKa = 9.6TGTLISYY67 pKa = 8.23TEE69 pKa = 4.21TPITLYY75 pKa = 10.53PNGEE79 pKa = 3.97AFMTLLYY86 pKa = 10.6NYY88 pKa = 10.41NNGNVATGALQEE100 pKa = 4.37GSTVIDD106 pKa = 3.78VYY108 pKa = 11.21FPTSYY113 pKa = 10.73SYY115 pKa = 11.85NSVTYY120 pKa = 10.63NVINTYY126 pKa = 10.86GFTDD130 pKa = 4.01PSGANPSFAIEE141 pKa = 4.12GTYY144 pKa = 9.56TGQPPFSDD152 pKa = 3.8TGWDD156 pKa = 3.84GMWINGAPEE165 pKa = 5.0PINAVAGHH173 pKa = 6.49SSTTDD178 pKa = 3.07VGGTAPIPSYY188 pKa = 10.29YY189 pKa = 10.45AEE191 pKa = 4.38SGLTLFHH198 pKa = 6.8NVFINYY204 pKa = 7.91WYY206 pKa = 10.81NPYY209 pKa = 10.73AWYY212 pKa = 9.73FSIGTPQDD220 pKa = 3.63YY221 pKa = 10.35SAHH224 pKa = 5.72GLNYY228 pKa = 9.25VQLSEE233 pKa = 4.1GQSYY237 pKa = 7.68NTINGLNYY245 pKa = 9.71ALYY248 pKa = 9.55WISPP252 pKa = 3.82
Molecular weight: 27.86 kDa
Isoelectric point according different methods:
Protein with the highest isoelectric point:
>tr|Q6TDN5|Q6TDN5_9VIRU ORF B83 OS=Sulfolobus virus Kamchatka 1 OX=248496 PE=4 SV=1
MM1 pKa = 6.81MRR3 pKa = 11.84WMSNGLVSPKK13 pKa = 10.17NIRR16 pKa = 11.84RR17 pKa = 11.84NSPRR21 pKa = 11.84FRR23 pKa = 11.84FNYY26 pKa = 9.77AHH28 pKa = 6.59YY29 pKa = 10.08CFTIQKK35 pKa = 9.56VKK37 pKa = 10.18AQEE40 pKa = 3.87RR41 pKa = 11.84EE42 pKa = 4.31TNIKK46 pKa = 8.85PQIHH50 pKa = 6.06RR51 pKa = 11.84VLSHH55 pKa = 6.65RR56 pKa = 11.84GFGISLTRR64 pKa = 11.84RR65 pKa = 11.84ALCLLHH71 pKa = 6.68HH72 pKa = 6.86LRR74 pKa = 11.84NLFYY78 pKa = 11.04GIIDD82 pKa = 3.46
MM1 pKa = 6.81MRR3 pKa = 11.84WMSNGLVSPKK13 pKa = 10.17NIRR16 pKa = 11.84RR17 pKa = 11.84NSPRR21 pKa = 11.84FRR23 pKa = 11.84FNYY26 pKa = 9.77AHH28 pKa = 6.59YY29 pKa = 10.08CFTIQKK35 pKa = 9.56VKK37 pKa = 10.18AQEE40 pKa = 3.87RR41 pKa = 11.84EE42 pKa = 4.31TNIKK46 pKa = 8.85PQIHH50 pKa = 6.06RR51 pKa = 11.84VLSHH55 pKa = 6.65RR56 pKa = 11.84GFGISLTRR64 pKa = 11.84RR65 pKa = 11.84ALCLLHH71 pKa = 6.68HH72 pKa = 6.86LRR74 pKa = 11.84NLFYY78 pKa = 11.04GIIDD82 pKa = 3.46
Molecular weight: 9.85 kDa
Isoelectric point according different methods:
Peptides (in silico digests for buttom-up proteomics)
Below you can find in silico digests of the whole proteome with Trypsin, Chymotrypsin, Trypsin+LysC, LysN, ArgC proteases suitable for different mass spec machines.| Try ESI |
 |
|---|
| ChTry ESI |
 |
|---|
| ArgC ESI |
 |
|---|
| LysN ESI |
 |
|---|
| TryLysC ESI |
 |
|---|
| Try MALDI |
 |
|---|
| ChTry MALDI |
 |
|---|
| ArgC MALDI |
 |
|---|
| LysN MALDI |
 |
|---|
| TryLysC MALDI |
 |
|---|
| Try LTQ |
 |
|---|
| ChTry LTQ |
 |
|---|
| ArgC LTQ |
 |
|---|
| LysN LTQ |
 |
|---|
| TryLysC LTQ |
 |
|---|
| Try MSlow |
 |
|---|
| ChTry MSlow |
 |
|---|
| ArgC MSlow |
 |
|---|
| LysN MSlow |
 |
|---|
| TryLysC MSlow |
 |
|---|
| Try MShigh |
 |
|---|
| ChTry MShigh |
 |
|---|
| ArgC MShigh |
 |
|---|
| LysN MShigh |
 |
|---|
| TryLysC MShigh |
 |
|---|
General Statistics
Number of major isoforms |
Number of additional isoforms |
Number of all proteins |
Number of amino acids |
Min. Seq. Length |
Max. Seq. Length |
Avg. Seq. Length |
Avg. Mol. Weight |
|---|---|---|---|---|---|---|---|
0 |
5333 |
43 |
793 |
172.0 |
19.57 |
Amino acid frequency
Ala |
Cys |
Asp |
Glu |
Phe |
Gly |
His |
Ile |
Lys |
Leu |
|---|---|---|---|---|---|---|---|---|---|
5.382 ± 0.391 | 0.694 ± 0.222 |
3.394 ± 0.469 | 6.207 ± 0.927 |
4.744 ± 0.329 | 6.413 ± 0.631 |
1.144 ± 0.25 | 7.65 ± 0.427 |
7.332 ± 1.106 | 11.082 ± 0.654 |
Met |
Asn |
Gln |
Pro |
Arg |
Ser |
Thr |
Val |
Trp |
Tyr |
|---|---|---|---|---|---|---|---|---|---|
2.1 ± 0.213 | 5.044 ± 0.542 |
4.125 ± 0.329 | 2.925 ± 0.331 |
4.088 ± 0.671 | 6.45 ± 0.682 |
6.469 ± 0.666 | 7.463 ± 0.399 |
1.331 ± 0.163 | 5.963 ± 0.558 |
Most of the basic statistics you can see at this page can be downloaded from this CSV file
Proteome-pI is available under Creative Commons Attribution-NoDerivs license, for more details see here
| Reference: Kozlowski LP. Proteome-pI 2.0: Proteome Isoelectric Point Database Update. Nucleic Acids Res. 2021, doi: 10.1093/nar/gkab944 | Contact: Lukasz P. Kozlowski |
