Xanthomonas phage phiXv2
Taxonomy: Viruses; Monodnaviria; Loebvirae; Hofneiviricota; Faserviricetes; Tubulavirales; Inoviridae; unclassified Inoviridae
Average proteome isoelectric point is 7.57
Get precalculated fractions of proteins

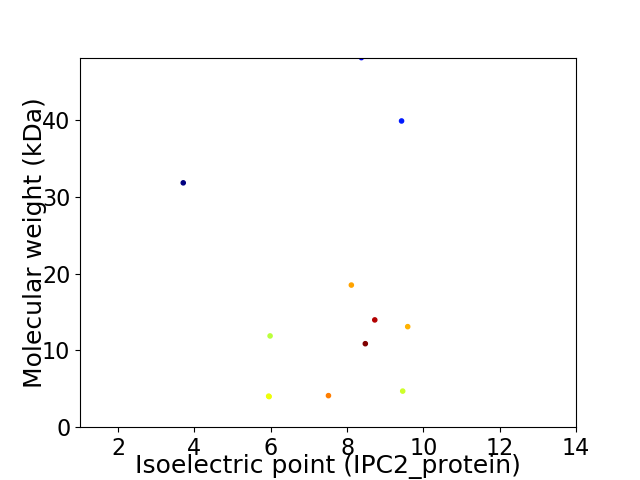
Virtual 2D-PAGE plot for 12 proteins (isoelectric point calculated using IPC2_protein)
Get csv file with sequences according to given criteria:
* You can choose from 21 different methods for calculating isoelectric point
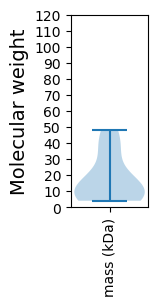
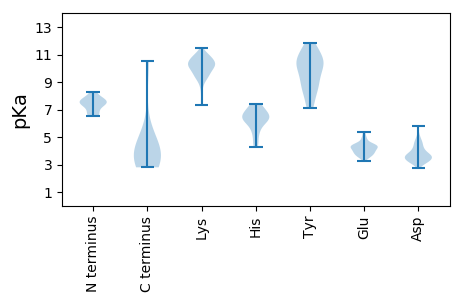
Summary statistics related to proteome-wise predictions


Protein with the lowest isoelectric point:
>tr|A0A2Z4QHX2|A0A2Z4QHX2_9VIRU Replication initiation protein OS=Xanthomonas phage phiXv2 OX=2201472 PE=4 SV=1
MM1 pKa = 6.52ITVRR5 pKa = 11.84LVACILAVALWSCAFSANAAMCRR28 pKa = 11.84DD29 pKa = 3.58AADD32 pKa = 4.16ACDD35 pKa = 3.34QGQAFLAARR44 pKa = 11.84MLADD48 pKa = 3.26QRR50 pKa = 11.84GVDD53 pKa = 3.69LCKK56 pKa = 10.56LVGGSNSLYY65 pKa = 10.45KK66 pKa = 11.0GPDD69 pKa = 3.14VVAEE73 pKa = 3.98SAGIYY78 pKa = 9.08NAQATCSIGGPAGAGSTFYY97 pKa = 11.28SKK99 pKa = 9.39TCAQRR104 pKa = 11.84PPLIGASSSDD114 pKa = 3.3GSGFSCDD121 pKa = 4.58DD122 pKa = 3.36GCFYY126 pKa = 11.22NFTVGASGGSGMYY139 pKa = 10.05PSGATCSAGDD149 pKa = 4.66APPSTPGDD157 pKa = 3.73DD158 pKa = 4.8GGDD161 pKa = 3.51GDD163 pKa = 4.7GGSDD167 pKa = 3.22GGGDD171 pKa = 3.53GGSDD175 pKa = 3.17GGGDD179 pKa = 3.53GGSDD183 pKa = 3.17GGGDD187 pKa = 3.57GGSDD191 pKa = 3.23GGSDD195 pKa = 3.81GGGDD199 pKa = 3.74GDD201 pKa = 5.07GDD203 pKa = 4.06GDD205 pKa = 4.55GDD207 pKa = 4.55GDD209 pKa = 4.29GDD211 pKa = 4.77GDD213 pKa = 4.51GDD215 pKa = 4.1TPGDD219 pKa = 3.86GDD221 pKa = 4.04GTTPGQGEE229 pKa = 4.5GGEE232 pKa = 4.19GAPMSEE238 pKa = 5.38LYY240 pKa = 10.52NKK242 pKa = 10.02SGKK245 pKa = 7.31TVEE248 pKa = 4.36SVLSKK253 pKa = 10.98FNTQVRR259 pKa = 11.84GTPMVAGITDD269 pKa = 4.56FMTVPSGGSCPVFSLGASKK288 pKa = 8.92WWNAMTINFHH298 pKa = 6.93CGGDD302 pKa = 3.5FLAFLRR308 pKa = 11.84AAGWVILAIAAYY320 pKa = 8.93AALRR324 pKa = 11.84IAVTT328 pKa = 3.72
MM1 pKa = 6.52ITVRR5 pKa = 11.84LVACILAVALWSCAFSANAAMCRR28 pKa = 11.84DD29 pKa = 3.58AADD32 pKa = 4.16ACDD35 pKa = 3.34QGQAFLAARR44 pKa = 11.84MLADD48 pKa = 3.26QRR50 pKa = 11.84GVDD53 pKa = 3.69LCKK56 pKa = 10.56LVGGSNSLYY65 pKa = 10.45KK66 pKa = 11.0GPDD69 pKa = 3.14VVAEE73 pKa = 3.98SAGIYY78 pKa = 9.08NAQATCSIGGPAGAGSTFYY97 pKa = 11.28SKK99 pKa = 9.39TCAQRR104 pKa = 11.84PPLIGASSSDD114 pKa = 3.3GSGFSCDD121 pKa = 4.58DD122 pKa = 3.36GCFYY126 pKa = 11.22NFTVGASGGSGMYY139 pKa = 10.05PSGATCSAGDD149 pKa = 4.66APPSTPGDD157 pKa = 3.73DD158 pKa = 4.8GGDD161 pKa = 3.51GDD163 pKa = 4.7GGSDD167 pKa = 3.22GGGDD171 pKa = 3.53GGSDD175 pKa = 3.17GGGDD179 pKa = 3.53GGSDD183 pKa = 3.17GGGDD187 pKa = 3.57GGSDD191 pKa = 3.23GGSDD195 pKa = 3.81GGGDD199 pKa = 3.74GDD201 pKa = 5.07GDD203 pKa = 4.06GDD205 pKa = 4.55GDD207 pKa = 4.55GDD209 pKa = 4.29GDD211 pKa = 4.77GDD213 pKa = 4.51GDD215 pKa = 4.1TPGDD219 pKa = 3.86GDD221 pKa = 4.04GTTPGQGEE229 pKa = 4.5GGEE232 pKa = 4.19GAPMSEE238 pKa = 5.38LYY240 pKa = 10.52NKK242 pKa = 10.02SGKK245 pKa = 7.31TVEE248 pKa = 4.36SVLSKK253 pKa = 10.98FNTQVRR259 pKa = 11.84GTPMVAGITDD269 pKa = 4.56FMTVPSGGSCPVFSLGASKK288 pKa = 8.92WWNAMTINFHH298 pKa = 6.93CGGDD302 pKa = 3.5FLAFLRR308 pKa = 11.84AAGWVILAIAAYY320 pKa = 8.93AALRR324 pKa = 11.84IAVTT328 pKa = 3.72
Molecular weight: 31.85 kDa
Isoelectric point according different methods:
Protein with the highest isoelectric point:
>tr|A0A2Z4QI91|A0A2Z4QI91_9VIRU Helix-turn-helix XRE-family DNA binding protein OS=Xanthomonas phage phiXv2 OX=2201472 PE=4 SV=1
MM1 pKa = 7.39ARR3 pKa = 11.84WCPPVNRR10 pKa = 11.84LASAAATCSSVVANTACMRR29 pKa = 11.84WCKK32 pKa = 10.19KK33 pKa = 10.21RR34 pKa = 11.84SPCPARR40 pKa = 11.84RR41 pKa = 11.84TPP43 pKa = 3.41
MM1 pKa = 7.39ARR3 pKa = 11.84WCPPVNRR10 pKa = 11.84LASAAATCSSVVANTACMRR29 pKa = 11.84WCKK32 pKa = 10.19KK33 pKa = 10.21RR34 pKa = 11.84SPCPARR40 pKa = 11.84RR41 pKa = 11.84TPP43 pKa = 3.41
Molecular weight: 4.71 kDa
Isoelectric point according different methods:
Peptides (in silico digests for buttom-up proteomics)
Below you can find in silico digests of the whole proteome with Trypsin, Chymotrypsin, Trypsin+LysC, LysN, ArgC proteases suitable for different mass spec machines.| Try ESI |
 |
|---|
| ChTry ESI |
 |
|---|
| ArgC ESI |
 |
|---|
| LysN ESI |
 |
|---|
| TryLysC ESI |
 |
|---|
| Try MALDI |
 |
|---|
| ChTry MALDI |
 |
|---|
| ArgC MALDI |
 |
|---|
| LysN MALDI |
 |
|---|
| TryLysC MALDI |
 |
|---|
| Try LTQ |
 |
|---|
| ChTry LTQ |
 |
|---|
| ArgC LTQ |
 |
|---|
| LysN LTQ |
 |
|---|
| TryLysC LTQ |
 |
|---|
| Try MSlow |
 |
|---|
| ChTry MSlow |
 |
|---|
| ArgC MSlow |
 |
|---|
| LysN MSlow |
 |
|---|
| TryLysC MSlow |
 |
|---|
| Try MShigh |
 |
|---|
| ChTry MShigh |
 |
|---|
| ArgC MShigh |
 |
|---|
| LysN MShigh |
 |
|---|
| TryLysC MShigh |
 |
|---|
General Statistics
Number of major isoforms |
Number of additional isoforms |
Number of all proteins |
Number of amino acids |
Min. Seq. Length |
Max. Seq. Length |
Avg. Seq. Length |
Avg. Mol. Weight |
|---|---|---|---|---|---|---|---|
0 |
1894 |
33 |
440 |
157.8 |
17.1 |
Amino acid frequency
Ala |
Cys |
Asp |
Glu |
Phe |
Gly |
His |
Ile |
Lys |
Leu |
|---|---|---|---|---|---|---|---|---|---|
11.827 ± 1.126 | 2.059 ± 0.633 |
5.861 ± 1.034 | 3.749 ± 0.648 |
4.224 ± 0.561 | 10.718 ± 2.371 |
1.637 ± 0.48 | 3.643 ± 0.452 |
4.435 ± 0.706 | 7.233 ± 1.018 |
Met |
Asn |
Gln |
Pro |
Arg |
Ser |
Thr |
Val |
Trp |
Tyr |
|---|---|---|---|---|---|---|---|---|---|
2.693 ± 0.491 | 2.429 ± 0.429 |
4.857 ± 0.519 | 3.115 ± 0.524 |
6.969 ± 1.281 | 6.23 ± 0.863 |
5.702 ± 0.678 | 7.392 ± 0.692 |
2.64 ± 0.514 | 2.587 ± 0.306 |
Most of the basic statistics you can see at this page can be downloaded from this CSV file
Proteome-pI is available under Creative Commons Attribution-NoDerivs license, for more details see here
| Reference: Kozlowski LP. Proteome-pI 2.0: Proteome Isoelectric Point Database Update. Nucleic Acids Res. 2021, doi: 10.1093/nar/gkab944 | Contact: Lukasz P. Kozlowski |
