Neptunomonas marina
Taxonomy: cellular organisms; Bacteria; Proteobacteria; Gammaproteobacteria; Oceanospirillales; Oceanospirillaceae; Neptunomonas
Average proteome isoelectric point is 6.0
Get precalculated fractions of proteins

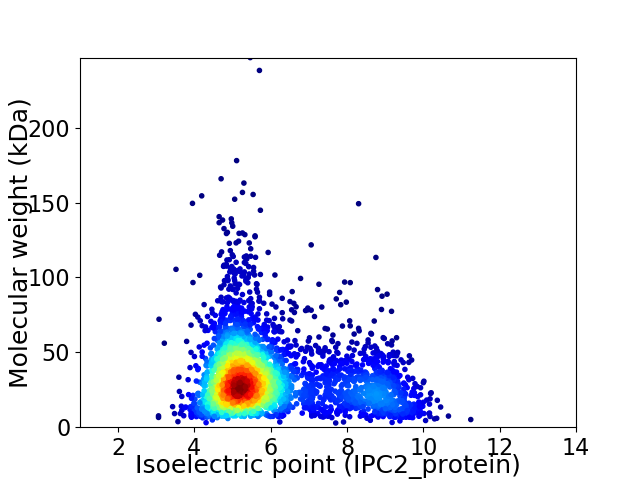
Virtual 2D-PAGE plot for 3482 proteins (isoelectric point calculated using IPC2_protein)
Get csv file with sequences according to given criteria:
* You can choose from 21 different methods for calculating isoelectric point
Summary statistics related to proteome-wise predictions


Protein with the lowest isoelectric point:
>tr|A0A437Q3U1|A0A437Q3U1_9GAMM Histidine kinase OS=Neptunomonas marina OX=1815562 GN=EOE65_17370 PE=4 SV=1
MM1 pKa = 7.83RR2 pKa = 11.84AHH4 pKa = 7.03TYY6 pKa = 10.29SGYY9 pKa = 8.87LTLLFAVCAVFLFPSKK25 pKa = 10.79ASAYY29 pKa = 10.83LMGDD33 pKa = 3.98GGCTTDD39 pKa = 3.3SVSITGISEE48 pKa = 4.32TSSGTPIYY56 pKa = 10.47SGSLSATSCAGLFQGINDD74 pKa = 4.21GPANNPDD81 pKa = 3.85PNIGEE86 pKa = 4.43LEE88 pKa = 4.2DD89 pKa = 4.3GFLNGEE95 pKa = 4.18PVKK98 pKa = 10.15TGPRR102 pKa = 11.84TEE104 pKa = 5.41DD105 pKa = 3.29GLDD108 pKa = 3.41PLTFIDD114 pKa = 4.03STEE117 pKa = 3.96LQALSGDD124 pKa = 4.6GIFDD128 pKa = 3.93DD129 pKa = 5.23PGWIHH134 pKa = 6.79LAEE137 pKa = 5.04IDD139 pKa = 3.66ADD141 pKa = 3.7SGTRR145 pKa = 11.84YY146 pKa = 10.51SFLDD150 pKa = 3.57TLDD153 pKa = 3.94LASVLDD159 pKa = 3.86VSLVCNLGPPNDD171 pKa = 4.32CKK173 pKa = 11.19GGTWNLAVDD182 pKa = 4.48PAAIAAVQAILGPNSFDD199 pKa = 3.07HH200 pKa = 6.49LAFVFKK206 pKa = 10.83SSTAVSIYY214 pKa = 10.93DD215 pKa = 3.57FDD217 pKa = 6.51FIDD220 pKa = 4.48LAPAIGGGFNFATAYY235 pKa = 9.23TFTGNWNMDD244 pKa = 3.58DD245 pKa = 3.91FQNPNNNNAQGYY257 pKa = 6.78SHH259 pKa = 7.11ISFWARR265 pKa = 11.84DD266 pKa = 3.58PADD269 pKa = 3.7AADD272 pKa = 3.96GTEE275 pKa = 3.97IPTPGTLVLFGLGLLLLLFRR295 pKa = 11.84LRR297 pKa = 11.84LGRR300 pKa = 11.84AA301 pKa = 3.18
MM1 pKa = 7.83RR2 pKa = 11.84AHH4 pKa = 7.03TYY6 pKa = 10.29SGYY9 pKa = 8.87LTLLFAVCAVFLFPSKK25 pKa = 10.79ASAYY29 pKa = 10.83LMGDD33 pKa = 3.98GGCTTDD39 pKa = 3.3SVSITGISEE48 pKa = 4.32TSSGTPIYY56 pKa = 10.47SGSLSATSCAGLFQGINDD74 pKa = 4.21GPANNPDD81 pKa = 3.85PNIGEE86 pKa = 4.43LEE88 pKa = 4.2DD89 pKa = 4.3GFLNGEE95 pKa = 4.18PVKK98 pKa = 10.15TGPRR102 pKa = 11.84TEE104 pKa = 5.41DD105 pKa = 3.29GLDD108 pKa = 3.41PLTFIDD114 pKa = 4.03STEE117 pKa = 3.96LQALSGDD124 pKa = 4.6GIFDD128 pKa = 3.93DD129 pKa = 5.23PGWIHH134 pKa = 6.79LAEE137 pKa = 5.04IDD139 pKa = 3.66ADD141 pKa = 3.7SGTRR145 pKa = 11.84YY146 pKa = 10.51SFLDD150 pKa = 3.57TLDD153 pKa = 3.94LASVLDD159 pKa = 3.86VSLVCNLGPPNDD171 pKa = 4.32CKK173 pKa = 11.19GGTWNLAVDD182 pKa = 4.48PAAIAAVQAILGPNSFDD199 pKa = 3.07HH200 pKa = 6.49LAFVFKK206 pKa = 10.83SSTAVSIYY214 pKa = 10.93DD215 pKa = 3.57FDD217 pKa = 6.51FIDD220 pKa = 4.48LAPAIGGGFNFATAYY235 pKa = 9.23TFTGNWNMDD244 pKa = 3.58DD245 pKa = 3.91FQNPNNNNAQGYY257 pKa = 6.78SHH259 pKa = 7.11ISFWARR265 pKa = 11.84DD266 pKa = 3.58PADD269 pKa = 3.7AADD272 pKa = 3.96GTEE275 pKa = 3.97IPTPGTLVLFGLGLLLLLFRR295 pKa = 11.84LRR297 pKa = 11.84LGRR300 pKa = 11.84AA301 pKa = 3.18
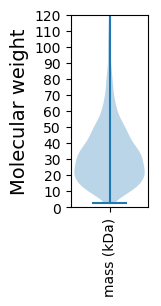
Molecular weight: 31.72 kDa
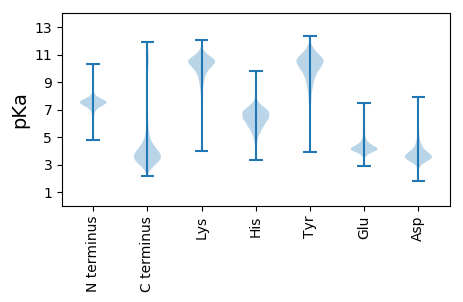
Isoelectric point according different methods:
Protein with the highest isoelectric point:
>tr|A0A437QB87|A0A437QB87_9GAMM Probable nicotinate-nucleotide adenylyltransferase OS=Neptunomonas marina OX=1815562 GN=nadD PE=3 SV=1
MM1 pKa = 7.45KK2 pKa = 9.51RR3 pKa = 11.84TFQPSVLKK11 pKa = 10.49RR12 pKa = 11.84ARR14 pKa = 11.84THH16 pKa = 5.91GFRR19 pKa = 11.84ARR21 pKa = 11.84MATKK25 pKa = 10.31SGRR28 pKa = 11.84AVINRR33 pKa = 11.84RR34 pKa = 11.84RR35 pKa = 11.84AKK37 pKa = 9.7GRR39 pKa = 11.84KK40 pKa = 8.85RR41 pKa = 11.84LSAA44 pKa = 3.96
MM1 pKa = 7.45KK2 pKa = 9.51RR3 pKa = 11.84TFQPSVLKK11 pKa = 10.49RR12 pKa = 11.84ARR14 pKa = 11.84THH16 pKa = 5.91GFRR19 pKa = 11.84ARR21 pKa = 11.84MATKK25 pKa = 10.31SGRR28 pKa = 11.84AVINRR33 pKa = 11.84RR34 pKa = 11.84RR35 pKa = 11.84AKK37 pKa = 9.7GRR39 pKa = 11.84KK40 pKa = 8.85RR41 pKa = 11.84LSAA44 pKa = 3.96
Molecular weight: 5.11 kDa
Isoelectric point according different methods:
Peptides (in silico digests for buttom-up proteomics)
Below you can find in silico digests of the whole proteome with Trypsin, Chymotrypsin, Trypsin+LysC, LysN, ArgC proteases suitable for different mass spec machines.| Try ESI |
 |
|---|
| ChTry ESI |
 |
|---|
| ArgC ESI |
 |
|---|
| LysN ESI |
 |
|---|
| TryLysC ESI |
 |
|---|
| Try MALDI |
 |
|---|
| ChTry MALDI |
 |
|---|
| ArgC MALDI |
 |
|---|
| LysN MALDI |
 |
|---|
| TryLysC MALDI |
 |
|---|
| Try LTQ |
 |
|---|
| ChTry LTQ |
 |
|---|
| ArgC LTQ |
 |
|---|
| LysN LTQ |
 |
|---|
| TryLysC LTQ |
 |
|---|
| Try MSlow |
 |
|---|
| ChTry MSlow |
 |
|---|
| ArgC MSlow |
 |
|---|
| LysN MSlow |
 |
|---|
| TryLysC MSlow |
 |
|---|
| Try MShigh |
 |
|---|
| ChTry MShigh |
 |
|---|
| ArgC MShigh |
 |
|---|
| LysN MShigh |
 |
|---|
| TryLysC MShigh |
 |
|---|
General Statistics
Number of major isoforms |
Number of additional isoforms |
Number of all proteins |
Number of amino acids |
Min. Seq. Length |
Max. Seq. Length |
Avg. Seq. Length |
Avg. Mol. Weight |
|---|---|---|---|---|---|---|---|
0 |
1104039 |
23 |
2272 |
317.1 |
35.0 |
Amino acid frequency
Ala |
Cys |
Asp |
Glu |
Phe |
Gly |
His |
Ile |
Lys |
Leu |
|---|---|---|---|---|---|---|---|---|---|
10.116 ± 0.051 | 1.026 ± 0.015 |
5.532 ± 0.033 | 6.395 ± 0.038 |
3.836 ± 0.031 | 7.045 ± 0.038 |
2.293 ± 0.023 | 5.715 ± 0.031 |
4.279 ± 0.034 | 10.742 ± 0.054 |
Met |
Asn |
Gln |
Pro |
Arg |
Ser |
Thr |
Val |
Trp |
Tyr |
|---|---|---|---|---|---|---|---|---|---|
2.53 ± 0.018 | 3.447 ± 0.026 |
4.264 ± 0.027 | 4.692 ± 0.034 |
5.406 ± 0.033 | 6.245 ± 0.029 |
5.233 ± 0.024 | 7.196 ± 0.036 |
1.237 ± 0.016 | 2.771 ± 0.024 |
Most of the basic statistics you can see at this page can be downloaded from this CSV file
Proteome-pI is available under Creative Commons Attribution-NoDerivs license, for more details see here
| Reference: Kozlowski LP. Proteome-pI 2.0: Proteome Isoelectric Point Database Update. Nucleic Acids Res. 2021, doi: 10.1093/nar/gkab944 | Contact: Lukasz P. Kozlowski |
