Knoellia remsis
Taxonomy: cellular organisms; Bacteria; Terrabacteria group; Actinobacteria; Actinomycetia; Micrococcales; Intrasporangiaceae; Knoellia
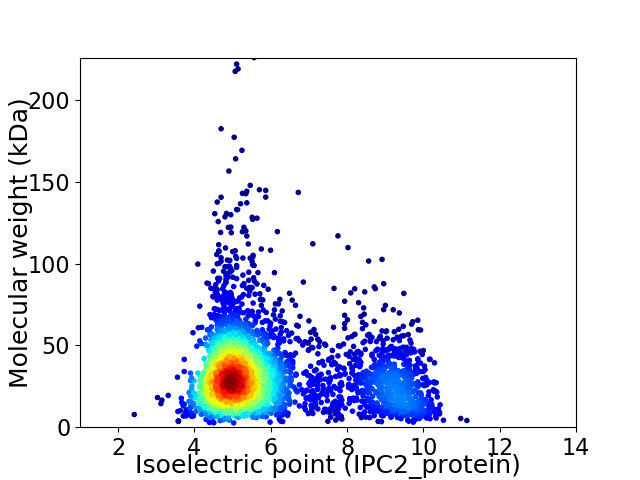
Average proteome isoelectric point is 6.03
Get precalculated fractions of proteins

Virtual 2D-PAGE plot for 3374 proteins (isoelectric point calculated using IPC2_protein)
Get csv file with sequences according to given criteria:
* You can choose from 21 different methods for calculating isoelectric point
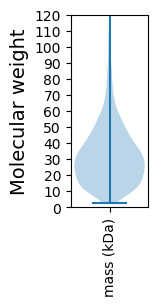
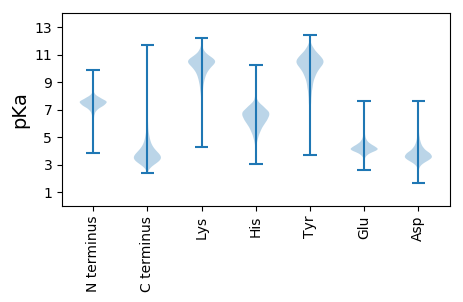
Summary statistics related to proteome-wise predictions


Protein with the lowest isoelectric point:
>tr|A0A2T0UQU7|A0A2T0UQU7_9MICO Amino acid ABC transporter membrane protein (PAAT family) OS=Knoellia remsis OX=407159 GN=BCF74_10791 PE=3 SV=1
MM1 pKa = 7.51RR2 pKa = 11.84RR3 pKa = 11.84SFLAGLAGLALALTTLVGASPAGAINSYY31 pKa = 9.57NAEE34 pKa = 4.14PAPEE38 pKa = 3.97RR39 pKa = 11.84TEE41 pKa = 4.04VGALVGFYY49 pKa = 10.83DD50 pKa = 4.81RR51 pKa = 11.84DD52 pKa = 3.37GDD54 pKa = 4.1GYY56 pKa = 11.17LDD58 pKa = 3.53RR59 pKa = 11.84FRR61 pKa = 11.84WYY63 pKa = 9.26CTGTMVDD70 pKa = 4.91DD71 pKa = 4.29DD72 pKa = 4.52TFLTAAHH79 pKa = 6.29CTDD82 pKa = 3.87GGLPDD87 pKa = 4.27DD88 pKa = 4.77RR89 pKa = 11.84YY90 pKa = 10.2FVSLEE95 pKa = 3.76EE96 pKa = 4.56DD97 pKa = 3.63FQGLLDD103 pKa = 5.53AYY105 pKa = 10.07DD106 pKa = 4.16KK107 pKa = 11.55EE108 pKa = 4.41NGPVPTDD115 pKa = 3.4PAEE118 pKa = 4.33LEE120 pKa = 4.27TYY122 pKa = 10.57LATKK126 pKa = 9.09VQYY129 pKa = 10.57FLDD132 pKa = 3.55QGWIVEE138 pKa = 4.46GTPHH142 pKa = 6.91QDD144 pKa = 2.87PEE146 pKa = 4.54YY147 pKa = 9.46PGNGSDD153 pKa = 3.68SQDD156 pKa = 2.82IAVIDD161 pKa = 4.03FAQWDD166 pKa = 4.16TTPQDD171 pKa = 3.08VWDD174 pKa = 4.92FTPATLPTLGQLDD187 pKa = 4.16EE188 pKa = 4.89LGSRR192 pKa = 11.84ALDD195 pKa = 3.78AADD198 pKa = 3.08WWVVGYY204 pKa = 7.56GTSEE208 pKa = 4.09AVRR211 pKa = 11.84GPGGQTHH218 pKa = 7.19PGGGVRR224 pKa = 11.84MKK226 pKa = 11.13ALVDD230 pKa = 4.54FNALNPTWVRR240 pKa = 11.84LGMIAARR247 pKa = 11.84GYY249 pKa = 11.08GGACYY254 pKa = 10.24GDD256 pKa = 3.53SGGPNYY262 pKa = 10.34VEE264 pKa = 4.83IDD266 pKa = 3.65GQLVLAATTITGDD279 pKa = 3.91GPCYY283 pKa = 9.17ATNVVYY289 pKa = 10.67RR290 pKa = 11.84LDD292 pKa = 3.65TEE294 pKa = 4.47GARR297 pKa = 11.84EE298 pKa = 3.85FLAPYY303 pKa = 10.37VDD305 pKa = 4.75LPP307 pKa = 3.95
MM1 pKa = 7.51RR2 pKa = 11.84RR3 pKa = 11.84SFLAGLAGLALALTTLVGASPAGAINSYY31 pKa = 9.57NAEE34 pKa = 4.14PAPEE38 pKa = 3.97RR39 pKa = 11.84TEE41 pKa = 4.04VGALVGFYY49 pKa = 10.83DD50 pKa = 4.81RR51 pKa = 11.84DD52 pKa = 3.37GDD54 pKa = 4.1GYY56 pKa = 11.17LDD58 pKa = 3.53RR59 pKa = 11.84FRR61 pKa = 11.84WYY63 pKa = 9.26CTGTMVDD70 pKa = 4.91DD71 pKa = 4.29DD72 pKa = 4.52TFLTAAHH79 pKa = 6.29CTDD82 pKa = 3.87GGLPDD87 pKa = 4.27DD88 pKa = 4.77RR89 pKa = 11.84YY90 pKa = 10.2FVSLEE95 pKa = 3.76EE96 pKa = 4.56DD97 pKa = 3.63FQGLLDD103 pKa = 5.53AYY105 pKa = 10.07DD106 pKa = 4.16KK107 pKa = 11.55EE108 pKa = 4.41NGPVPTDD115 pKa = 3.4PAEE118 pKa = 4.33LEE120 pKa = 4.27TYY122 pKa = 10.57LATKK126 pKa = 9.09VQYY129 pKa = 10.57FLDD132 pKa = 3.55QGWIVEE138 pKa = 4.46GTPHH142 pKa = 6.91QDD144 pKa = 2.87PEE146 pKa = 4.54YY147 pKa = 9.46PGNGSDD153 pKa = 3.68SQDD156 pKa = 2.82IAVIDD161 pKa = 4.03FAQWDD166 pKa = 4.16TTPQDD171 pKa = 3.08VWDD174 pKa = 4.92FTPATLPTLGQLDD187 pKa = 4.16EE188 pKa = 4.89LGSRR192 pKa = 11.84ALDD195 pKa = 3.78AADD198 pKa = 3.08WWVVGYY204 pKa = 7.56GTSEE208 pKa = 4.09AVRR211 pKa = 11.84GPGGQTHH218 pKa = 7.19PGGGVRR224 pKa = 11.84MKK226 pKa = 11.13ALVDD230 pKa = 4.54FNALNPTWVRR240 pKa = 11.84LGMIAARR247 pKa = 11.84GYY249 pKa = 11.08GGACYY254 pKa = 10.24GDD256 pKa = 3.53SGGPNYY262 pKa = 10.34VEE264 pKa = 4.83IDD266 pKa = 3.65GQLVLAATTITGDD279 pKa = 3.91GPCYY283 pKa = 9.17ATNVVYY289 pKa = 10.67RR290 pKa = 11.84LDD292 pKa = 3.65TEE294 pKa = 4.47GARR297 pKa = 11.84EE298 pKa = 3.85FLAPYY303 pKa = 10.37VDD305 pKa = 4.75LPP307 pKa = 3.95
Molecular weight: 33.02 kDa
Isoelectric point according different methods:
Protein with the highest isoelectric point:
>tr|A0A2T0UN72|A0A2T0UN72_9MICO NADH-quinone oxidoreductase subunit B OS=Knoellia remsis OX=407159 GN=nuoB PE=3 SV=1
MM1 pKa = 7.4GSVIKK6 pKa = 10.42KK7 pKa = 8.47RR8 pKa = 11.84RR9 pKa = 11.84KK10 pKa = 9.22RR11 pKa = 11.84MAKK14 pKa = 9.41KK15 pKa = 9.87KK16 pKa = 9.7HH17 pKa = 5.84RR18 pKa = 11.84KK19 pKa = 8.56LLRR22 pKa = 11.84KK23 pKa = 7.78TRR25 pKa = 11.84HH26 pKa = 3.65QRR28 pKa = 11.84RR29 pKa = 11.84NKK31 pKa = 9.78KK32 pKa = 9.85
MM1 pKa = 7.4GSVIKK6 pKa = 10.42KK7 pKa = 8.47RR8 pKa = 11.84RR9 pKa = 11.84KK10 pKa = 9.22RR11 pKa = 11.84MAKK14 pKa = 9.41KK15 pKa = 9.87KK16 pKa = 9.7HH17 pKa = 5.84RR18 pKa = 11.84KK19 pKa = 8.56LLRR22 pKa = 11.84KK23 pKa = 7.78TRR25 pKa = 11.84HH26 pKa = 3.65QRR28 pKa = 11.84RR29 pKa = 11.84NKK31 pKa = 9.78KK32 pKa = 9.85
Molecular weight: 4.08 kDa
Isoelectric point according different methods:
Peptides (in silico digests for buttom-up proteomics)
Below you can find in silico digests of the whole proteome with Trypsin, Chymotrypsin, Trypsin+LysC, LysN, ArgC proteases suitable for different mass spec machines.| Try ESI |
 |
|---|
| ChTry ESI |
 |
|---|
| ArgC ESI |
 |
|---|
| LysN ESI |
 |
|---|
| TryLysC ESI |
 |
|---|
| Try MALDI |
 |
|---|
| ChTry MALDI |
 |
|---|
| ArgC MALDI |
 |
|---|
| LysN MALDI |
 |
|---|
| TryLysC MALDI |
 |
|---|
| Try LTQ |
 |
|---|
| ChTry LTQ |
 |
|---|
| ArgC LTQ |
 |
|---|
| LysN LTQ |
 |
|---|
| TryLysC LTQ |
 |
|---|
| Try MSlow |
 |
|---|
| ChTry MSlow |
 |
|---|
| ArgC MSlow |
 |
|---|
| LysN MSlow |
 |
|---|
| TryLysC MSlow |
 |
|---|
| Try MShigh |
 |
|---|
| ChTry MShigh |
 |
|---|
| ArgC MShigh |
 |
|---|
| LysN MShigh |
 |
|---|
| TryLysC MShigh |
 |
|---|
General Statistics
Number of major isoforms |
Number of additional isoforms |
Number of all proteins |
Number of amino acids |
Min. Seq. Length |
Max. Seq. Length |
Avg. Seq. Length |
Avg. Mol. Weight |
|---|---|---|---|---|---|---|---|
0 |
1082194 |
24 |
2174 |
320.7 |
34.29 |
Amino acid frequency
Ala |
Cys |
Asp |
Glu |
Phe |
Gly |
His |
Ile |
Lys |
Leu |
|---|---|---|---|---|---|---|---|---|---|
13.076 ± 0.057 | 0.621 ± 0.01 |
6.536 ± 0.039 | 5.765 ± 0.048 |
2.741 ± 0.03 | 9.319 ± 0.04 |
2.04 ± 0.021 | 3.592 ± 0.03 |
2.169 ± 0.034 | 9.745 ± 0.051 |
Met |
Asn |
Gln |
Pro |
Arg |
Ser |
Thr |
Val |
Trp |
Tyr |
|---|---|---|---|---|---|---|---|---|---|
1.854 ± 0.016 | 1.837 ± 0.026 |
5.654 ± 0.032 | 2.742 ± 0.022 |
7.604 ± 0.053 | 5.496 ± 0.032 |
6.499 ± 0.042 | 9.291 ± 0.043 |
1.573 ± 0.02 | 1.847 ± 0.02 |
Most of the basic statistics you can see at this page can be downloaded from this CSV file
Proteome-pI is available under Creative Commons Attribution-NoDerivs license, for more details see here
| Reference: Kozlowski LP. Proteome-pI 2.0: Proteome Isoelectric Point Database Update. Nucleic Acids Res. 2021, doi: 10.1093/nar/gkab944 | Contact: Lukasz P. Kozlowski |
