Mucilaginibacter sp. ZH6
Taxonomy: cellular organisms; Bacteria; FCB group; Bacteroidetes/Chlorobi group; Bacteroidetes; Sphingobacteriia; Sphingobacteriales; Sphingobacteriaceae; Mucilaginibacter; unclassified Mucilaginibacter
Average proteome isoelectric point is 6.91
Get precalculated fractions of proteins

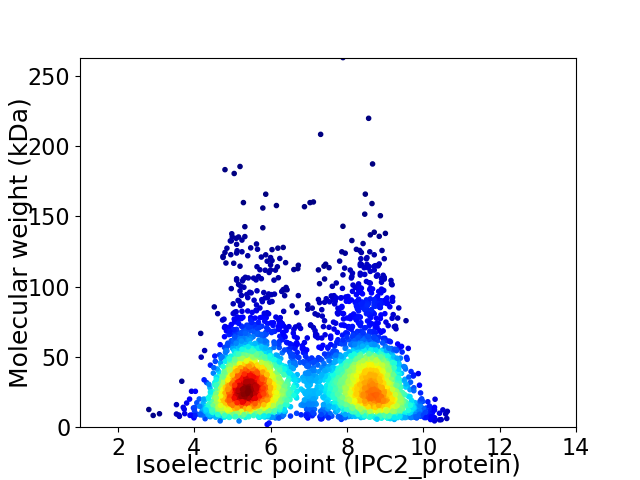
Virtual 2D-PAGE plot for 4079 proteins (isoelectric point calculated using IPC2_protein)
Get csv file with sequences according to given criteria:
* You can choose from 21 different methods for calculating isoelectric point
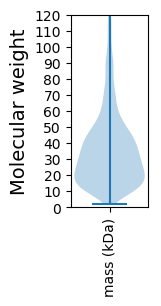
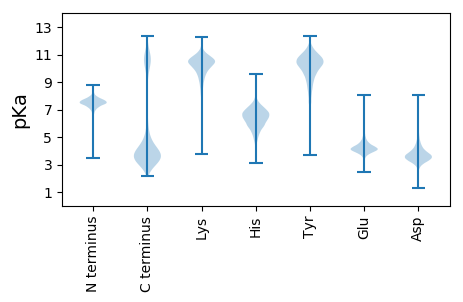
Summary statistics related to proteome-wise predictions


Protein with the lowest isoelectric point:
>tr|A0A3E2NT28|A0A3E2NT28_9SPHI Efflux transporter outer membrane subunit OS=Mucilaginibacter sp. ZH6 OX=2482727 GN=DYU05_00260 PE=3 SV=1
MM1 pKa = 7.64SEE3 pKa = 4.16ANYY6 pKa = 8.34PTEE9 pKa = 4.87GPDD12 pKa = 3.32GTIPVQDD19 pKa = 3.53GVNWTTNWRR28 pKa = 11.84TYY30 pKa = 11.21LDD32 pKa = 3.38QSDD35 pKa = 3.89NDD37 pKa = 3.25FHH39 pKa = 7.96IQYY42 pKa = 10.31FNIPIVDD49 pKa = 4.44FQNILTFNPGAEE61 pKa = 4.18SVRR64 pKa = 11.84AYY66 pKa = 9.88IGLTDD71 pKa = 3.8ATDD74 pKa = 3.32PMTAKK79 pKa = 10.79LILVPVVDD87 pKa = 3.99GHH89 pKa = 6.38DD90 pKa = 3.99VIVVHH95 pKa = 7.04PDD97 pKa = 2.86LGGGVAGDD105 pKa = 4.08GQSNIYY111 pKa = 11.09DD112 pKa = 3.71MTQACPPNCPANDD125 pKa = 4.0SIMYY129 pKa = 9.86AA130 pKa = 3.5
MM1 pKa = 7.64SEE3 pKa = 4.16ANYY6 pKa = 8.34PTEE9 pKa = 4.87GPDD12 pKa = 3.32GTIPVQDD19 pKa = 3.53GVNWTTNWRR28 pKa = 11.84TYY30 pKa = 11.21LDD32 pKa = 3.38QSDD35 pKa = 3.89NDD37 pKa = 3.25FHH39 pKa = 7.96IQYY42 pKa = 10.31FNIPIVDD49 pKa = 4.44FQNILTFNPGAEE61 pKa = 4.18SVRR64 pKa = 11.84AYY66 pKa = 9.88IGLTDD71 pKa = 3.8ATDD74 pKa = 3.32PMTAKK79 pKa = 10.79LILVPVVDD87 pKa = 3.99GHH89 pKa = 6.38DD90 pKa = 3.99VIVVHH95 pKa = 7.04PDD97 pKa = 2.86LGGGVAGDD105 pKa = 4.08GQSNIYY111 pKa = 11.09DD112 pKa = 3.71MTQACPPNCPANDD125 pKa = 4.0SIMYY129 pKa = 9.86AA130 pKa = 3.5
Molecular weight: 14.13 kDa
Isoelectric point according different methods:
Protein with the highest isoelectric point:
>tr|A0A3E2NQG5|A0A3E2NQG5_9SPHI Polymerase OS=Mucilaginibacter sp. ZH6 OX=2482727 GN=DYU05_13945 PE=4 SV=1
MM1 pKa = 7.34KK2 pKa = 10.34RR3 pKa = 11.84ATFDD7 pKa = 3.28STALTRR13 pKa = 11.84LIKK16 pKa = 10.55CCSFFMLMLSATIASAQKK34 pKa = 10.71GKK36 pKa = 8.63VTVVRR41 pKa = 11.84DD42 pKa = 3.68PLFDD46 pKa = 3.39TLLAKK51 pKa = 10.35RR52 pKa = 11.84ALLNRR57 pKa = 11.84KK58 pKa = 8.97GGSSVARR65 pKa = 11.84FTSSYY70 pKa = 10.7GYY72 pKa = 10.67RR73 pKa = 11.84LQIYY77 pKa = 9.56NGSNRR82 pKa = 11.84SAAYY86 pKa = 9.51AAQARR91 pKa = 11.84FNRR94 pKa = 11.84EE95 pKa = 3.55FPEE98 pKa = 3.5MRR100 pKa = 11.84TYY102 pKa = 10.64ISYY105 pKa = 10.54RR106 pKa = 11.84EE107 pKa = 3.95PNFKK111 pKa = 10.14VRR113 pKa = 11.84AGDD116 pKa = 3.29FRR118 pKa = 11.84TRR120 pKa = 11.84LEE122 pKa = 3.88AEE124 pKa = 4.02RR125 pKa = 11.84LKK127 pKa = 11.06SQLGNTFTAMFIVSEE142 pKa = 4.62KK143 pKa = 10.34INPPKK148 pKa = 10.24TVINNDD154 pKa = 2.99
MM1 pKa = 7.34KK2 pKa = 10.34RR3 pKa = 11.84ATFDD7 pKa = 3.28STALTRR13 pKa = 11.84LIKK16 pKa = 10.55CCSFFMLMLSATIASAQKK34 pKa = 10.71GKK36 pKa = 8.63VTVVRR41 pKa = 11.84DD42 pKa = 3.68PLFDD46 pKa = 3.39TLLAKK51 pKa = 10.35RR52 pKa = 11.84ALLNRR57 pKa = 11.84KK58 pKa = 8.97GGSSVARR65 pKa = 11.84FTSSYY70 pKa = 10.7GYY72 pKa = 10.67RR73 pKa = 11.84LQIYY77 pKa = 9.56NGSNRR82 pKa = 11.84SAAYY86 pKa = 9.51AAQARR91 pKa = 11.84FNRR94 pKa = 11.84EE95 pKa = 3.55FPEE98 pKa = 3.5MRR100 pKa = 11.84TYY102 pKa = 10.64ISYY105 pKa = 10.54RR106 pKa = 11.84EE107 pKa = 3.95PNFKK111 pKa = 10.14VRR113 pKa = 11.84AGDD116 pKa = 3.29FRR118 pKa = 11.84TRR120 pKa = 11.84LEE122 pKa = 3.88AEE124 pKa = 4.02RR125 pKa = 11.84LKK127 pKa = 11.06SQLGNTFTAMFIVSEE142 pKa = 4.62KK143 pKa = 10.34INPPKK148 pKa = 10.24TVINNDD154 pKa = 2.99
Molecular weight: 17.47 kDa
Isoelectric point according different methods:
Peptides (in silico digests for buttom-up proteomics)
Below you can find in silico digests of the whole proteome with Trypsin, Chymotrypsin, Trypsin+LysC, LysN, ArgC proteases suitable for different mass spec machines.| Try ESI |
 |
|---|
| ChTry ESI |
 |
|---|
| ArgC ESI |
 |
|---|
| LysN ESI |
 |
|---|
| TryLysC ESI |
 |
|---|
| Try MALDI |
 |
|---|
| ChTry MALDI |
 |
|---|
| ArgC MALDI |
 |
|---|
| LysN MALDI |
 |
|---|
| TryLysC MALDI |
 |
|---|
| Try LTQ |
 |
|---|
| ChTry LTQ |
 |
|---|
| ArgC LTQ |
 |
|---|
| LysN LTQ |
 |
|---|
| TryLysC LTQ |
 |
|---|
| Try MSlow |
 |
|---|
| ChTry MSlow |
 |
|---|
| ArgC MSlow |
 |
|---|
| LysN MSlow |
 |
|---|
| TryLysC MSlow |
 |
|---|
| Try MShigh |
 |
|---|
| ChTry MShigh |
 |
|---|
| ArgC MShigh |
 |
|---|
| LysN MShigh |
 |
|---|
| TryLysC MShigh |
 |
|---|
General Statistics
Number of major isoforms |
Number of additional isoforms |
Number of all proteins |
Number of amino acids |
Min. Seq. Length |
Max. Seq. Length |
Avg. Seq. Length |
Avg. Mol. Weight |
|---|---|---|---|---|---|---|---|
0 |
1373186 |
18 |
2339 |
336.6 |
37.65 |
Amino acid frequency
Ala |
Cys |
Asp |
Glu |
Phe |
Gly |
His |
Ile |
Lys |
Leu |
|---|---|---|---|---|---|---|---|---|---|
7.922 ± 0.039 | 0.782 ± 0.011 |
5.449 ± 0.026 | 5.421 ± 0.042 |
4.808 ± 0.028 | 6.885 ± 0.036 |
1.892 ± 0.018 | 6.953 ± 0.035 |
6.834 ± 0.036 | 9.463 ± 0.037 |
Met |
Asn |
Gln |
Pro |
Arg |
Ser |
Thr |
Val |
Trp |
Tyr |
|---|---|---|---|---|---|---|---|---|---|
2.313 ± 0.019 | 5.525 ± 0.039 |
3.912 ± 0.023 | 3.749 ± 0.028 |
4.076 ± 0.021 | 6.146 ± 0.028 |
5.892 ± 0.037 | 6.675 ± 0.029 |
1.168 ± 0.014 | 4.134 ± 0.031 |
Most of the basic statistics you can see at this page can be downloaded from this CSV file
Proteome-pI is available under Creative Commons Attribution-NoDerivs license, for more details see here
| Reference: Kozlowski LP. Proteome-pI 2.0: Proteome Isoelectric Point Database Update. Nucleic Acids Res. 2021, doi: 10.1093/nar/gkab944 | Contact: Lukasz P. Kozlowski |
