Halovirus HCTV-5
Taxonomy: Viruses; unclassified viruses; unclassified DNA viruses; unclassified archaeal dsDNA viruses; Haloviruses
Average proteome isoelectric point is 4.94
Get precalculated fractions of proteins
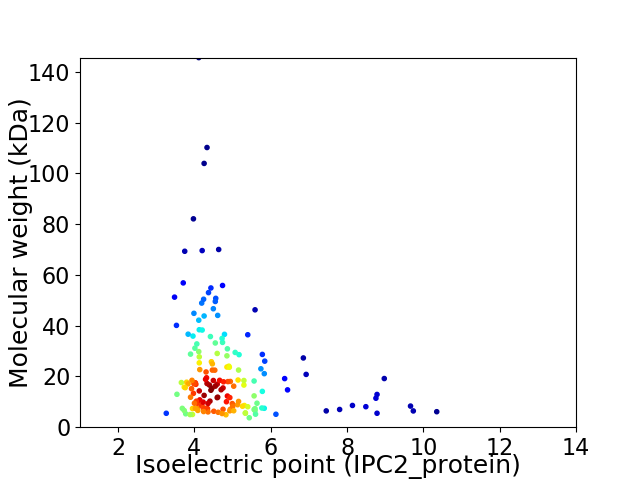
Virtual 2D-PAGE plot for 166 proteins (isoelectric point calculated using IPC2_protein)
Get csv file with sequences according to given criteria:
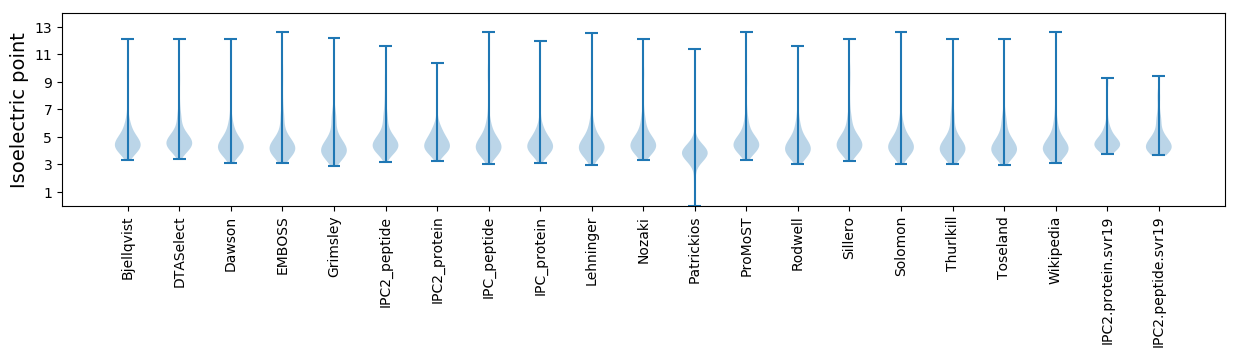
* You can choose from 21 different methods for calculating isoelectric point
Summary statistics related to proteome-wise predictions
Protein with the lowest isoelectric point:
>tr|R4TLQ7|R4TLQ7_9VIRU Uncharacterized protein OS=Halovirus HCTV-5 OX=1273748 GN=37 PE=4 SV=1
MM1 pKa = 7.99LYY3 pKa = 10.62RR4 pKa = 11.84MDD6 pKa = 3.67EE7 pKa = 4.3HH8 pKa = 6.34LTSAVSRR15 pKa = 11.84AFEE18 pKa = 4.23KK19 pKa = 11.29EE20 pKa = 3.18EE21 pKa = 4.29DD22 pKa = 4.04LPDD25 pKa = 4.04GAVDD29 pKa = 3.97EE30 pKa = 5.67DD31 pKa = 4.19DD32 pKa = 4.59TEE34 pKa = 4.29ASPMDD39 pKa = 3.64IEE41 pKa = 4.99HH42 pKa = 5.81EE43 pKa = 4.09QIYY46 pKa = 10.68YY47 pKa = 10.91LLADD51 pKa = 5.14AYY53 pKa = 9.65PDD55 pKa = 3.58QFDD58 pKa = 4.01GPEE61 pKa = 3.81DD62 pKa = 3.64ARR64 pKa = 11.84DD65 pKa = 3.82QIHH68 pKa = 6.26EE69 pKa = 4.01ALGVEE74 pKa = 4.36EE75 pKa = 4.58EE76 pKa = 4.54KK77 pKa = 11.21GVDD80 pKa = 3.6DD81 pKa = 4.78EE82 pKa = 4.6EE83 pKa = 5.18DD84 pKa = 3.76RR85 pKa = 11.84EE86 pKa = 4.3EE87 pKa = 4.09TSEE90 pKa = 4.86DD91 pKa = 3.56FNPANTPDD99 pKa = 4.33NLDD102 pKa = 3.19QHH104 pKa = 6.91PYY106 pKa = 11.1DD107 pKa = 3.63EE108 pKa = 5.84AEE110 pKa = 3.82WQEE113 pKa = 4.4DD114 pKa = 4.23YY115 pKa = 10.99EE116 pKa = 4.88AEE118 pKa = 4.24YY119 pKa = 11.36GDD121 pKa = 4.14DD122 pKa = 3.53QAEE125 pKa = 4.34EE126 pKa = 4.34KK127 pKa = 11.06ACDD130 pKa = 3.66HH131 pKa = 6.54TDD133 pKa = 2.82HH134 pKa = 7.4RR135 pKa = 11.84GRR137 pKa = 11.84PLDD140 pKa = 3.8EE141 pKa = 6.22DD142 pKa = 3.59EE143 pKa = 5.63CPWCGEE149 pKa = 4.07DD150 pKa = 5.98DD151 pKa = 3.95EE152 pKa = 5.24
MM1 pKa = 7.99LYY3 pKa = 10.62RR4 pKa = 11.84MDD6 pKa = 3.67EE7 pKa = 4.3HH8 pKa = 6.34LTSAVSRR15 pKa = 11.84AFEE18 pKa = 4.23KK19 pKa = 11.29EE20 pKa = 3.18EE21 pKa = 4.29DD22 pKa = 4.04LPDD25 pKa = 4.04GAVDD29 pKa = 3.97EE30 pKa = 5.67DD31 pKa = 4.19DD32 pKa = 4.59TEE34 pKa = 4.29ASPMDD39 pKa = 3.64IEE41 pKa = 4.99HH42 pKa = 5.81EE43 pKa = 4.09QIYY46 pKa = 10.68YY47 pKa = 10.91LLADD51 pKa = 5.14AYY53 pKa = 9.65PDD55 pKa = 3.58QFDD58 pKa = 4.01GPEE61 pKa = 3.81DD62 pKa = 3.64ARR64 pKa = 11.84DD65 pKa = 3.82QIHH68 pKa = 6.26EE69 pKa = 4.01ALGVEE74 pKa = 4.36EE75 pKa = 4.58EE76 pKa = 4.54KK77 pKa = 11.21GVDD80 pKa = 3.6DD81 pKa = 4.78EE82 pKa = 4.6EE83 pKa = 5.18DD84 pKa = 3.76RR85 pKa = 11.84EE86 pKa = 4.3EE87 pKa = 4.09TSEE90 pKa = 4.86DD91 pKa = 3.56FNPANTPDD99 pKa = 4.33NLDD102 pKa = 3.19QHH104 pKa = 6.91PYY106 pKa = 11.1DD107 pKa = 3.63EE108 pKa = 5.84AEE110 pKa = 3.82WQEE113 pKa = 4.4DD114 pKa = 4.23YY115 pKa = 10.99EE116 pKa = 4.88AEE118 pKa = 4.24YY119 pKa = 11.36GDD121 pKa = 4.14DD122 pKa = 3.53QAEE125 pKa = 4.34EE126 pKa = 4.34KK127 pKa = 11.06ACDD130 pKa = 3.66HH131 pKa = 6.54TDD133 pKa = 2.82HH134 pKa = 7.4RR135 pKa = 11.84GRR137 pKa = 11.84PLDD140 pKa = 3.8EE141 pKa = 6.22DD142 pKa = 3.59EE143 pKa = 5.63CPWCGEE149 pKa = 4.07DD150 pKa = 5.98DD151 pKa = 3.95EE152 pKa = 5.24
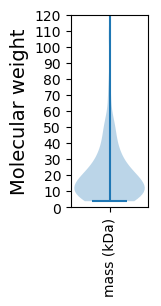
Molecular weight: 17.59 kDa
Isoelectric point according different methods:
Protein with the highest isoelectric point:
>tr|R4T7K3|R4T7K3_9VIRU Uncharacterized protein OS=Halovirus HCTV-5 OX=1273748 GN=145 PE=4 SV=1
MM1 pKa = 7.46ASEE4 pKa = 4.38LSGMVKK10 pKa = 8.46TWQVVAAGRR19 pKa = 11.84LSWNGPYY26 pKa = 10.73DD27 pKa = 4.08RR28 pKa = 11.84MPHH31 pKa = 6.38GGTNPYY37 pKa = 9.01RR38 pKa = 11.84WRR40 pKa = 11.84RR41 pKa = 11.84SSISQHH47 pKa = 5.72SLGEE51 pKa = 4.03GQAQVSSS58 pKa = 3.77
MM1 pKa = 7.46ASEE4 pKa = 4.38LSGMVKK10 pKa = 8.46TWQVVAAGRR19 pKa = 11.84LSWNGPYY26 pKa = 10.73DD27 pKa = 4.08RR28 pKa = 11.84MPHH31 pKa = 6.38GGTNPYY37 pKa = 9.01RR38 pKa = 11.84WRR40 pKa = 11.84RR41 pKa = 11.84SSISQHH47 pKa = 5.72SLGEE51 pKa = 4.03GQAQVSSS58 pKa = 3.77
Molecular weight: 6.4 kDa
Isoelectric point according different methods:
Peptides (in silico digests for buttom-up proteomics)
Below you can find in silico digests of the whole proteome with Trypsin, Chymotrypsin, Trypsin+LysC, LysN, ArgC proteases suitable for different mass spec machines.| Try ESI |
 |
|---|
| ChTry ESI |
|
|---|
| ArgC ESI |
|
|---|
| LysN ESI |
|
|---|
| TryLysC ESI |
|
|---|
| Try MALDI |
|
|---|
| ChTry MALDI |
|
|---|
| ArgC MALDI |
|
|---|
| LysN MALDI |
|
|---|
| TryLysC MALDI |
|
|---|
| Try LTQ |
|
|---|
| ChTry LTQ |
|
|---|
| ArgC LTQ |
|
|---|
| LysN LTQ |
|
|---|
| TryLysC LTQ |
|
|---|
| Try MSlow |
|
|---|
| ChTry MSlow |
|
|---|
| ArgC MSlow |
|
|---|
| LysN MSlow |
|
|---|
| TryLysC MSlow |
|
|---|
| Try MShigh |
|
|---|
| ChTry MShigh |
|
|---|
| ArgC MShigh |
|
|---|
| LysN MShigh |
|
|---|
| TryLysC MShigh |
|
|---|
General Statistics
Number of major isoforms |
Number of additional isoforms |
Number of all proteins |
Number of amino acids |
Min. Seq. Length |
Max. Seq. Length |
Avg. Seq. Length |
Avg. Mol. Weight |
|---|---|---|---|---|---|---|---|
0 |
32513 |
33 |
1293 |
195.9 |
22.12 |
Amino acid frequency
Ala |
Cys |
Asp |
Glu |
Phe |
Gly |
His |
Ile |
Lys |
Leu |
|---|---|---|---|---|---|---|---|---|---|
6.705 ± 0.212 | 1.261 ± 0.099 |
9.707 ± 0.282 | 10.522 ± 0.314 |
3.122 ± 0.112 | 7.459 ± 0.219 |
2.365 ± 0.129 | 3.946 ± 0.132 |
4.008 ± 0.166 | 6.723 ± 0.16 |
Met |
Asn |
Gln |
Pro |
Arg |
Ser |
Thr |
Val |
Trp |
Tyr |
|---|---|---|---|---|---|---|---|---|---|
2.436 ± 0.097 | 3.758 ± 0.136 |
3.909 ± 0.138 | 3.559 ± 0.111 |
6.087 ± 0.202 | 6.124 ± 0.193 |
5.773 ± 0.203 | 7.317 ± 0.162 |
1.762 ± 0.095 | 3.457 ± 0.124 |
Most of the basic statistics you can see at this page can be downloaded from this CSV file
See this proteome in:

Proteome-pI is available under Creative Commons Attribution-NoDerivs license, for more details see here
| Reference: Kozlowski LP. Proteome-pI 2.0: Proteome Isoelectric Point Database Update. Nucleic Acids Res. 2021, doi: 10.1093/nar/gkab944 | Contact: Lukasz P. Kozlowski |