Ruminococcus sp. 1xD21-23
Taxonomy: cellular organisms; Bacteria; Terrabacteria group; Firmicutes; Clostridia; Eubacteriales; Oscillospiraceae; Ruminococcus; unclassified Ruminococcus
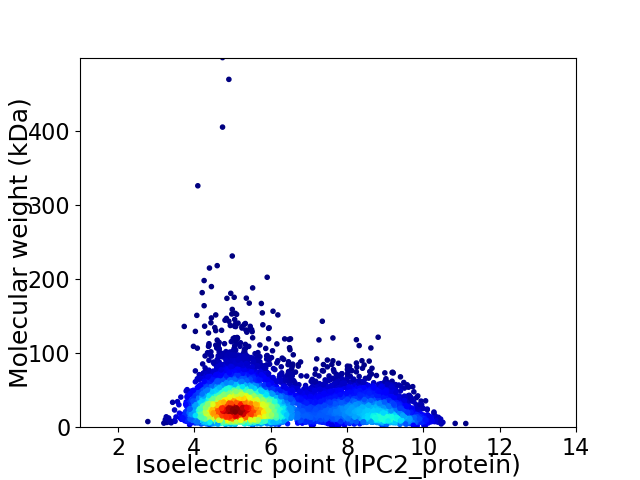
Average proteome isoelectric point is 6.08
Get precalculated fractions of proteins

Virtual 2D-PAGE plot for 7725 proteins (isoelectric point calculated using IPC2_protein)
Get csv file with sequences according to given criteria:
* You can choose from 21 different methods for calculating isoelectric point
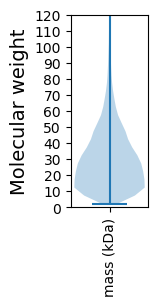
Summary statistics related to proteome-wise predictions


Protein with the lowest isoelectric point:
>tr|A0A3A9E0D3|A0A3A9E0D3_9FIRM Thymidylate synthase OS=Ruminococcus sp. 1xD21-23 OX=2320089 GN=D7W80_21115 PE=4 SV=1
MM1 pKa = 6.94MVAALGLGGCAGGDD15 pKa = 3.45GAQEE19 pKa = 4.07NGSVSDD25 pKa = 3.93AGAGGGSSAAKK36 pKa = 8.45TQGAEE41 pKa = 4.13PAGEE45 pKa = 4.02PAGEE49 pKa = 4.01AVTLQIFAANSLTKK63 pKa = 10.85AMAEE67 pKa = 3.93AQEE70 pKa = 6.0LYY72 pKa = 9.15TQQNPNVTFGDD83 pKa = 3.78TQYY86 pKa = 10.95EE87 pKa = 4.01ASGTLNEE94 pKa = 4.37MLGAGQYY101 pKa = 11.39ADD103 pKa = 3.57ILITASKK110 pKa = 9.43GTMDD114 pKa = 4.34DD115 pKa = 4.05AVDD118 pKa = 3.27AGYY121 pKa = 11.01VDD123 pKa = 3.9EE124 pKa = 4.76ATRR127 pKa = 11.84STMFTNQLVFVTKK140 pKa = 10.51EE141 pKa = 3.85GGEE144 pKa = 4.06LADD147 pKa = 3.73TDD149 pKa = 3.88VTLEE153 pKa = 4.02DD154 pKa = 3.93VAAGTYY160 pKa = 7.64TLSVGDD166 pKa = 4.1EE167 pKa = 4.02NVPAGNYY174 pKa = 9.21ACQALSTVGAYY185 pKa = 9.38IEE187 pKa = 4.61PDD189 pKa = 3.34GATGADD195 pKa = 3.22ATGKK199 pKa = 10.63GGEE202 pKa = 4.34FSDD205 pKa = 3.74ALKK208 pKa = 11.11DD209 pKa = 3.66KK210 pKa = 9.75VTLGGKK216 pKa = 9.65VGDD219 pKa = 3.59VCKK222 pKa = 10.52YY223 pKa = 11.13AEE225 pKa = 4.46TGDD228 pKa = 3.33VDD230 pKa = 4.23LAMVYY235 pKa = 10.07TSDD238 pKa = 3.64VYY240 pKa = 11.48RR241 pKa = 11.84MGGVTICSVVPDD253 pKa = 4.39DD254 pKa = 3.41THH256 pKa = 8.21KK257 pKa = 11.18AITYY261 pKa = 8.23PGAVTAQSEE270 pKa = 4.15NAEE273 pKa = 3.95AAKK276 pKa = 10.7AFLEE280 pKa = 4.11WCMTDD285 pKa = 3.5EE286 pKa = 4.87DD287 pKa = 5.05CAKK290 pKa = 9.96IWQEE294 pKa = 3.59WGFDD298 pKa = 3.46MATEE302 pKa = 4.16
MM1 pKa = 6.94MVAALGLGGCAGGDD15 pKa = 3.45GAQEE19 pKa = 4.07NGSVSDD25 pKa = 3.93AGAGGGSSAAKK36 pKa = 8.45TQGAEE41 pKa = 4.13PAGEE45 pKa = 4.02PAGEE49 pKa = 4.01AVTLQIFAANSLTKK63 pKa = 10.85AMAEE67 pKa = 3.93AQEE70 pKa = 6.0LYY72 pKa = 9.15TQQNPNVTFGDD83 pKa = 3.78TQYY86 pKa = 10.95EE87 pKa = 4.01ASGTLNEE94 pKa = 4.37MLGAGQYY101 pKa = 11.39ADD103 pKa = 3.57ILITASKK110 pKa = 9.43GTMDD114 pKa = 4.34DD115 pKa = 4.05AVDD118 pKa = 3.27AGYY121 pKa = 11.01VDD123 pKa = 3.9EE124 pKa = 4.76ATRR127 pKa = 11.84STMFTNQLVFVTKK140 pKa = 10.51EE141 pKa = 3.85GGEE144 pKa = 4.06LADD147 pKa = 3.73TDD149 pKa = 3.88VTLEE153 pKa = 4.02DD154 pKa = 3.93VAAGTYY160 pKa = 7.64TLSVGDD166 pKa = 4.1EE167 pKa = 4.02NVPAGNYY174 pKa = 9.21ACQALSTVGAYY185 pKa = 9.38IEE187 pKa = 4.61PDD189 pKa = 3.34GATGADD195 pKa = 3.22ATGKK199 pKa = 10.63GGEE202 pKa = 4.34FSDD205 pKa = 3.74ALKK208 pKa = 11.11DD209 pKa = 3.66KK210 pKa = 9.75VTLGGKK216 pKa = 9.65VGDD219 pKa = 3.59VCKK222 pKa = 10.52YY223 pKa = 11.13AEE225 pKa = 4.46TGDD228 pKa = 3.33VDD230 pKa = 4.23LAMVYY235 pKa = 10.07TSDD238 pKa = 3.64VYY240 pKa = 11.48RR241 pKa = 11.84MGGVTICSVVPDD253 pKa = 4.39DD254 pKa = 3.41THH256 pKa = 8.21KK257 pKa = 11.18AITYY261 pKa = 8.23PGAVTAQSEE270 pKa = 4.15NAEE273 pKa = 3.95AAKK276 pKa = 10.7AFLEE280 pKa = 4.11WCMTDD285 pKa = 3.5EE286 pKa = 4.87DD287 pKa = 5.05CAKK290 pKa = 9.96IWQEE294 pKa = 3.59WGFDD298 pKa = 3.46MATEE302 pKa = 4.16
Molecular weight: 30.92 kDa
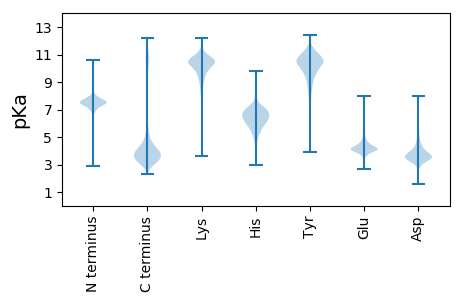
Isoelectric point according different methods:
Protein with the highest isoelectric point:
>tr|A0A3A9E1T4|A0A3A9E1T4_9FIRM Fibronectin type III domain-containing protein OS=Ruminococcus sp. 1xD21-23 OX=2320089 GN=D7W80_26235 PE=4 SV=1
MM1 pKa = 7.67KK2 pKa = 8.73MTFQPKK8 pKa = 8.63NRR10 pKa = 11.84QRR12 pKa = 11.84SKK14 pKa = 8.89VHH16 pKa = 5.88GFRR19 pKa = 11.84ARR21 pKa = 11.84MSTPGGRR28 pKa = 11.84KK29 pKa = 8.77VLASRR34 pKa = 11.84RR35 pKa = 11.84AKK37 pKa = 10.43GRR39 pKa = 11.84AKK41 pKa = 10.69LSAA44 pKa = 3.92
MM1 pKa = 7.67KK2 pKa = 8.73MTFQPKK8 pKa = 8.63NRR10 pKa = 11.84QRR12 pKa = 11.84SKK14 pKa = 8.89VHH16 pKa = 5.88GFRR19 pKa = 11.84ARR21 pKa = 11.84MSTPGGRR28 pKa = 11.84KK29 pKa = 8.77VLASRR34 pKa = 11.84RR35 pKa = 11.84AKK37 pKa = 10.43GRR39 pKa = 11.84AKK41 pKa = 10.69LSAA44 pKa = 3.92
Molecular weight: 4.98 kDa
Isoelectric point according different methods:
Peptides (in silico digests for buttom-up proteomics)
Below you can find in silico digests of the whole proteome with Trypsin, Chymotrypsin, Trypsin+LysC, LysN, ArgC proteases suitable for different mass spec machines.| Try ESI |
 |
|---|
| ChTry ESI |
 |
|---|
| ArgC ESI |
 |
|---|
| LysN ESI |
 |
|---|
| TryLysC ESI |
 |
|---|
| Try MALDI |
 |
|---|
| ChTry MALDI |
 |
|---|
| ArgC MALDI |
 |
|---|
| LysN MALDI |
 |
|---|
| TryLysC MALDI |
 |
|---|
| Try LTQ |
 |
|---|
| ChTry LTQ |
 |
|---|
| ArgC LTQ |
 |
|---|
| LysN LTQ |
 |
|---|
| TryLysC LTQ |
 |
|---|
| Try MSlow |
 |
|---|
| ChTry MSlow |
 |
|---|
| ArgC MSlow |
 |
|---|
| LysN MSlow |
 |
|---|
| TryLysC MSlow |
 |
|---|
| Try MShigh |
 |
|---|
| ChTry MShigh |
 |
|---|
| ArgC MShigh |
 |
|---|
| LysN MShigh |
 |
|---|
| TryLysC MShigh |
 |
|---|
General Statistics
Number of major isoforms |
Number of additional isoforms |
Number of all proteins |
Number of amino acids |
Min. Seq. Length |
Max. Seq. Length |
Avg. Seq. Length |
Avg. Mol. Weight |
|---|---|---|---|---|---|---|---|
0 |
2202755 |
17 |
4467 |
285.1 |
31.72 |
Amino acid frequency
Ala |
Cys |
Asp |
Glu |
Phe |
Gly |
His |
Ile |
Lys |
Leu |
|---|---|---|---|---|---|---|---|---|---|
9.044 ± 0.047 | 1.548 ± 0.014 |
5.643 ± 0.029 | 7.442 ± 0.034 |
4.037 ± 0.023 | 7.689 ± 0.031 |
1.762 ± 0.012 | 6.14 ± 0.031 |
5.657 ± 0.032 | 9.091 ± 0.032 |
Met |
Asn |
Gln |
Pro |
Arg |
Ser |
Thr |
Val |
Trp |
Tyr |
|---|---|---|---|---|---|---|---|---|---|
2.95 ± 0.017 | 3.771 ± 0.023 |
3.787 ± 0.021 | 3.288 ± 0.019 |
5.286 ± 0.025 | 5.664 ± 0.022 |
5.166 ± 0.023 | 7.136 ± 0.029 |
1.146 ± 0.01 | 3.752 ± 0.023 |
Most of the basic statistics you can see at this page can be downloaded from this CSV file
Proteome-pI is available under Creative Commons Attribution-NoDerivs license, for more details see here
| Reference: Kozlowski LP. Proteome-pI 2.0: Proteome Isoelectric Point Database Update. Nucleic Acids Res. 2021, doi: 10.1093/nar/gkab944 | Contact: Lukasz P. Kozlowski |
