Microbacterium sp. AR7-10
Taxonomy: cellular organisms; Bacteria; Terrabacteria group; Actinobacteria; Actinomycetia; Micrococcales; Microbacteriaceae; Microbacterium; unclassified Microbacterium
Average proteome isoelectric point is 6.0
Get precalculated fractions of proteins

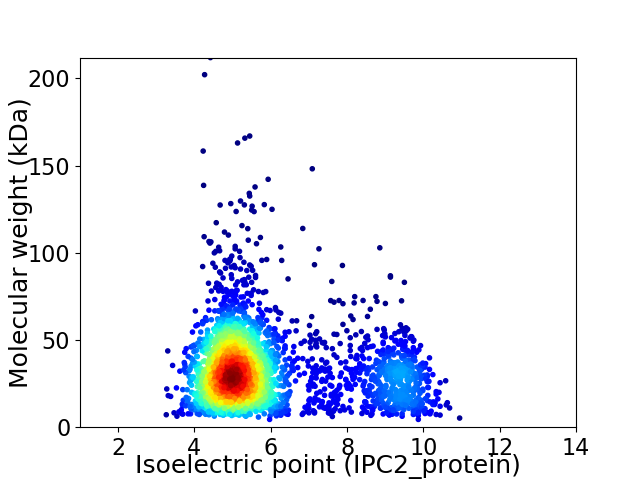
Virtual 2D-PAGE plot for 2773 proteins (isoelectric point calculated using IPC2_protein)
Get csv file with sequences according to given criteria:
* You can choose from 21 different methods for calculating isoelectric point
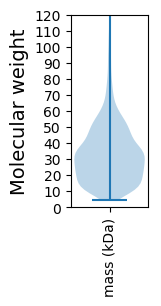
Summary statistics related to proteome-wise predictions


Protein with the lowest isoelectric point:
>tr|A0A1J6XDL3|A0A1J6XDL3_9MICO MFS transporter OS=Microbacterium sp. AR7-10 OX=1891970 GN=BFN01_08120 PE=4 SV=1
MM1 pKa = 7.48TLMGCASGNTGGGSAGDD18 pKa = 3.44GDD20 pKa = 4.0GGYY23 pKa = 10.42RR24 pKa = 11.84IALSMSYY31 pKa = 10.28SGNDD35 pKa = 3.3WQGEE39 pKa = 4.24AQSLVYY45 pKa = 10.21AAAEE49 pKa = 3.94SDD51 pKa = 3.6ALKK54 pKa = 11.03DD55 pKa = 3.57KK56 pKa = 10.87VDD58 pKa = 3.69SVEE61 pKa = 4.08TFIAGTDD68 pKa = 3.34AQTQISQIQQMITAQYY84 pKa = 10.52DD85 pKa = 3.53AILIYY90 pKa = 10.03PISPTALNQVIKK102 pKa = 10.15QGCDD106 pKa = 2.48AGIPMFTYY114 pKa = 10.23DD115 pKa = 3.87AVVTEE120 pKa = 4.67PCAKK124 pKa = 10.3NVTFDD129 pKa = 3.09QAEE132 pKa = 4.14FGKK135 pKa = 10.93VGAEE139 pKa = 3.95YY140 pKa = 10.67LSDD143 pKa = 4.31LMGDD147 pKa = 3.74TGNVVLITGVAGTSVDD163 pKa = 3.6EE164 pKa = 4.86DD165 pKa = 3.52RR166 pKa = 11.84TNAARR171 pKa = 11.84AVFEE175 pKa = 3.97EE176 pKa = 4.22RR177 pKa = 11.84GINVLDD183 pKa = 3.75SCAGDD188 pKa = 3.64WAQGPAGEE196 pKa = 4.38CMSRR200 pKa = 11.84FLAAFDD206 pKa = 5.93DD207 pKa = 4.36IDD209 pKa = 4.28GVWAQVGGVAVPAAFEE225 pKa = 3.85AAGRR229 pKa = 11.84PFVPMIAEE237 pKa = 4.15AEE239 pKa = 4.03NLYY242 pKa = 10.32RR243 pKa = 11.84LHH245 pKa = 6.81LQDD248 pKa = 4.64PEE250 pKa = 4.34YY251 pKa = 10.65IEE253 pKa = 5.66NGLQGGSAGSPPWQSAAALHH273 pKa = 5.37MAVRR277 pKa = 11.84AIEE280 pKa = 4.5GEE282 pKa = 4.3EE283 pKa = 4.17FPSTIDD289 pKa = 4.67VGFDD293 pKa = 2.63WATQEE298 pKa = 4.08DD299 pKa = 4.82LKK301 pKa = 10.89MCEE304 pKa = 3.95TGSAEE309 pKa = 4.09EE310 pKa = 5.35LEE312 pKa = 4.75AGCNTFPAGMVSDD325 pKa = 4.84GFMADD330 pKa = 2.47WWHH333 pKa = 6.78PEE335 pKa = 3.16WTAGIDD341 pKa = 3.97LDD343 pKa = 4.17TLLSVDD349 pKa = 3.23VDD351 pKa = 3.66
MM1 pKa = 7.48TLMGCASGNTGGGSAGDD18 pKa = 3.44GDD20 pKa = 4.0GGYY23 pKa = 10.42RR24 pKa = 11.84IALSMSYY31 pKa = 10.28SGNDD35 pKa = 3.3WQGEE39 pKa = 4.24AQSLVYY45 pKa = 10.21AAAEE49 pKa = 3.94SDD51 pKa = 3.6ALKK54 pKa = 11.03DD55 pKa = 3.57KK56 pKa = 10.87VDD58 pKa = 3.69SVEE61 pKa = 4.08TFIAGTDD68 pKa = 3.34AQTQISQIQQMITAQYY84 pKa = 10.52DD85 pKa = 3.53AILIYY90 pKa = 10.03PISPTALNQVIKK102 pKa = 10.15QGCDD106 pKa = 2.48AGIPMFTYY114 pKa = 10.23DD115 pKa = 3.87AVVTEE120 pKa = 4.67PCAKK124 pKa = 10.3NVTFDD129 pKa = 3.09QAEE132 pKa = 4.14FGKK135 pKa = 10.93VGAEE139 pKa = 3.95YY140 pKa = 10.67LSDD143 pKa = 4.31LMGDD147 pKa = 3.74TGNVVLITGVAGTSVDD163 pKa = 3.6EE164 pKa = 4.86DD165 pKa = 3.52RR166 pKa = 11.84TNAARR171 pKa = 11.84AVFEE175 pKa = 3.97EE176 pKa = 4.22RR177 pKa = 11.84GINVLDD183 pKa = 3.75SCAGDD188 pKa = 3.64WAQGPAGEE196 pKa = 4.38CMSRR200 pKa = 11.84FLAAFDD206 pKa = 5.93DD207 pKa = 4.36IDD209 pKa = 4.28GVWAQVGGVAVPAAFEE225 pKa = 3.85AAGRR229 pKa = 11.84PFVPMIAEE237 pKa = 4.15AEE239 pKa = 4.03NLYY242 pKa = 10.32RR243 pKa = 11.84LHH245 pKa = 6.81LQDD248 pKa = 4.64PEE250 pKa = 4.34YY251 pKa = 10.65IEE253 pKa = 5.66NGLQGGSAGSPPWQSAAALHH273 pKa = 5.37MAVRR277 pKa = 11.84AIEE280 pKa = 4.5GEE282 pKa = 4.3EE283 pKa = 4.17FPSTIDD289 pKa = 4.67VGFDD293 pKa = 2.63WATQEE298 pKa = 4.08DD299 pKa = 4.82LKK301 pKa = 10.89MCEE304 pKa = 3.95TGSAEE309 pKa = 4.09EE310 pKa = 5.35LEE312 pKa = 4.75AGCNTFPAGMVSDD325 pKa = 4.84GFMADD330 pKa = 2.47WWHH333 pKa = 6.78PEE335 pKa = 3.16WTAGIDD341 pKa = 3.97LDD343 pKa = 4.17TLLSVDD349 pKa = 3.23VDD351 pKa = 3.66
Molecular weight: 37.06 kDa
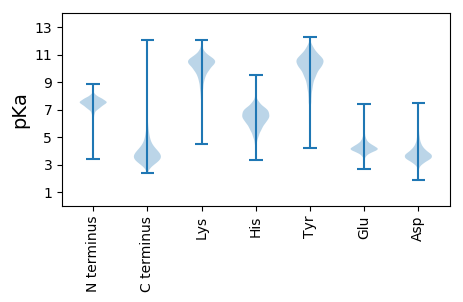
Isoelectric point according different methods:
Protein with the highest isoelectric point:
>tr|A0A1J6YEH4|A0A1J6YEH4_9MICO SGL domain-containing protein OS=Microbacterium sp. AR7-10 OX=1891970 GN=BFN01_03875 PE=4 SV=1
MM1 pKa = 7.69SKK3 pKa = 9.0RR4 pKa = 11.84TFQPNNRR11 pKa = 11.84RR12 pKa = 11.84RR13 pKa = 11.84AKK15 pKa = 10.04KK16 pKa = 8.86HH17 pKa = 4.36GFRR20 pKa = 11.84ARR22 pKa = 11.84MRR24 pKa = 11.84TRR26 pKa = 11.84AGRR29 pKa = 11.84AILAARR35 pKa = 11.84RR36 pKa = 11.84AKK38 pKa = 10.52GRR40 pKa = 11.84TEE42 pKa = 4.14LSAA45 pKa = 4.86
MM1 pKa = 7.69SKK3 pKa = 9.0RR4 pKa = 11.84TFQPNNRR11 pKa = 11.84RR12 pKa = 11.84RR13 pKa = 11.84AKK15 pKa = 10.04KK16 pKa = 8.86HH17 pKa = 4.36GFRR20 pKa = 11.84ARR22 pKa = 11.84MRR24 pKa = 11.84TRR26 pKa = 11.84AGRR29 pKa = 11.84AILAARR35 pKa = 11.84RR36 pKa = 11.84AKK38 pKa = 10.52GRR40 pKa = 11.84TEE42 pKa = 4.14LSAA45 pKa = 4.86
Molecular weight: 5.24 kDa
Isoelectric point according different methods:
Peptides (in silico digests for buttom-up proteomics)
Below you can find in silico digests of the whole proteome with Trypsin, Chymotrypsin, Trypsin+LysC, LysN, ArgC proteases suitable for different mass spec machines.| Try ESI |
 |
|---|
| ChTry ESI |
 |
|---|
| ArgC ESI |
 |
|---|
| LysN ESI |
 |
|---|
| TryLysC ESI |
 |
|---|
| Try MALDI |
 |
|---|
| ChTry MALDI |
 |
|---|
| ArgC MALDI |
 |
|---|
| LysN MALDI |
 |
|---|
| TryLysC MALDI |
 |
|---|
| Try LTQ |
 |
|---|
| ChTry LTQ |
 |
|---|
| ArgC LTQ |
 |
|---|
| LysN LTQ |
 |
|---|
| TryLysC LTQ |
 |
|---|
| Try MSlow |
 |
|---|
| ChTry MSlow |
 |
|---|
| ArgC MSlow |
 |
|---|
| LysN MSlow |
 |
|---|
| TryLysC MSlow |
 |
|---|
| Try MShigh |
 |
|---|
| ChTry MShigh |
 |
|---|
| ArgC MShigh |
 |
|---|
| LysN MShigh |
 |
|---|
| TryLysC MShigh |
 |
|---|
General Statistics
Number of major isoforms |
Number of additional isoforms |
Number of all proteins |
Number of amino acids |
Min. Seq. Length |
Max. Seq. Length |
Avg. Seq. Length |
Avg. Mol. Weight |
|---|---|---|---|---|---|---|---|
0 |
892355 |
38 |
2033 |
321.8 |
34.53 |
Amino acid frequency
Ala |
Cys |
Asp |
Glu |
Phe |
Gly |
His |
Ile |
Lys |
Leu |
|---|---|---|---|---|---|---|---|---|---|
13.454 ± 0.072 | 0.493 ± 0.01 |
6.442 ± 0.04 | 5.694 ± 0.038 |
3.107 ± 0.033 | 8.833 ± 0.041 |
2.032 ± 0.021 | 4.785 ± 0.033 |
2.025 ± 0.034 | 10.013 ± 0.056 |
Met |
Asn |
Gln |
Pro |
Arg |
Ser |
Thr |
Val |
Trp |
Tyr |
|---|---|---|---|---|---|---|---|---|---|
1.981 ± 0.019 | 1.884 ± 0.025 |
5.248 ± 0.029 | 2.939 ± 0.025 |
7.458 ± 0.051 | 5.534 ± 0.027 |
5.874 ± 0.033 | 8.771 ± 0.043 |
1.496 ± 0.018 | 1.936 ± 0.025 |
Most of the basic statistics you can see at this page can be downloaded from this CSV file
Proteome-pI is available under Creative Commons Attribution-NoDerivs license, for more details see here
| Reference: Kozlowski LP. Proteome-pI 2.0: Proteome Isoelectric Point Database Update. Nucleic Acids Res. 2021, doi: 10.1093/nar/gkab944 | Contact: Lukasz P. Kozlowski |
