Bovine leukemia virus (BLV)
Taxonomy: Viruses; Riboviria; Pararnavirae; Artverviricota; Revtraviricetes; Ortervirales; Retroviridae; Orthoretrovirinae; Deltaretrovirus
Average proteome isoelectric point is 7.72
Get precalculated fractions of proteins

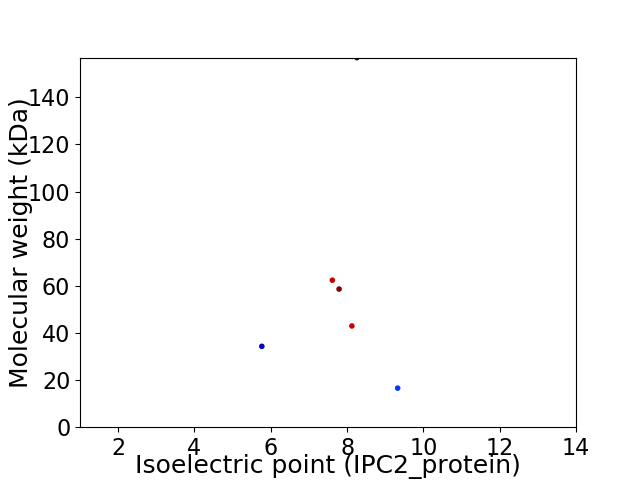
Virtual 2D-PAGE plot for 6 proteins (isoelectric point calculated using IPC2_protein)
Get csv file with sequences according to given criteria:
* You can choose from 21 different methods for calculating isoelectric point
Summary statistics related to proteome-wise predictions


Protein with the lowest isoelectric point:
>tr|O92812|O92812_BLV Gag-Pro-Pol polyprotein OS=Bovine leukemia virus OX=11901 GN=gag-pro-pol PE=4 SV=2
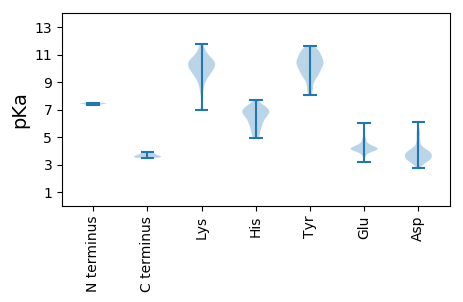
MM1 pKa = 7.49ASVVGWGPHH10 pKa = 5.48SLHH13 pKa = 6.78ACPALVLSNDD23 pKa = 3.22VTIDD27 pKa = 3.51AWCPLCGPHH36 pKa = 6.85EE37 pKa = 4.18RR38 pKa = 11.84LQFEE42 pKa = 5.11RR43 pKa = 11.84IDD45 pKa = 3.57TTLTCEE51 pKa = 3.95THH53 pKa = 7.04RR54 pKa = 11.84ITWTADD60 pKa = 2.77GRR62 pKa = 11.84PFGLNGTLFPRR73 pKa = 11.84LHH75 pKa = 7.17VSEE78 pKa = 4.88TRR80 pKa = 11.84PQGPRR85 pKa = 11.84RR86 pKa = 11.84LWINCPLPAVRR97 pKa = 11.84AQPGPVSLSPFEE109 pKa = 4.06QSPFQPYY116 pKa = 9.18QCQLPSASSDD126 pKa = 3.15GCPIIGHH133 pKa = 6.78GLLPWNNLVTHH144 pKa = 6.54PVLGKK149 pKa = 10.28VLILNQMANFSLLPPFDD166 pKa = 4.03TLLVDD171 pKa = 4.04PLRR174 pKa = 11.84LSVFAPDD181 pKa = 2.93TRR183 pKa = 11.84GAIRR187 pKa = 11.84YY188 pKa = 8.31LSTLLTLCPVTCILPLGEE206 pKa = 4.33PFSPNVPICRR216 pKa = 11.84FPRR219 pKa = 11.84DD220 pKa = 3.37TSEE223 pKa = 4.35PPLSEE228 pKa = 4.47FEE230 pKa = 4.65LPLIQTPGLSWSVPAIDD247 pKa = 5.57LFLTGPPSPYY257 pKa = 10.44DD258 pKa = 3.54RR259 pKa = 11.84LHH261 pKa = 5.97VWSSPQALQRR271 pKa = 11.84FLHH274 pKa = 6.92DD275 pKa = 3.76PTLTWSEE282 pKa = 3.97LVASGKK288 pKa = 10.09LRR290 pKa = 11.84LDD292 pKa = 3.72SPLKK296 pKa = 10.66LQLLEE301 pKa = 4.42NEE303 pKa = 4.0WLSRR307 pKa = 11.84LFF309 pKa = 3.92
MM1 pKa = 7.49ASVVGWGPHH10 pKa = 5.48SLHH13 pKa = 6.78ACPALVLSNDD23 pKa = 3.22VTIDD27 pKa = 3.51AWCPLCGPHH36 pKa = 6.85EE37 pKa = 4.18RR38 pKa = 11.84LQFEE42 pKa = 5.11RR43 pKa = 11.84IDD45 pKa = 3.57TTLTCEE51 pKa = 3.95THH53 pKa = 7.04RR54 pKa = 11.84ITWTADD60 pKa = 2.77GRR62 pKa = 11.84PFGLNGTLFPRR73 pKa = 11.84LHH75 pKa = 7.17VSEE78 pKa = 4.88TRR80 pKa = 11.84PQGPRR85 pKa = 11.84RR86 pKa = 11.84LWINCPLPAVRR97 pKa = 11.84AQPGPVSLSPFEE109 pKa = 4.06QSPFQPYY116 pKa = 9.18QCQLPSASSDD126 pKa = 3.15GCPIIGHH133 pKa = 6.78GLLPWNNLVTHH144 pKa = 6.54PVLGKK149 pKa = 10.28VLILNQMANFSLLPPFDD166 pKa = 4.03TLLVDD171 pKa = 4.04PLRR174 pKa = 11.84LSVFAPDD181 pKa = 2.93TRR183 pKa = 11.84GAIRR187 pKa = 11.84YY188 pKa = 8.31LSTLLTLCPVTCILPLGEE206 pKa = 4.33PFSPNVPICRR216 pKa = 11.84FPRR219 pKa = 11.84DD220 pKa = 3.37TSEE223 pKa = 4.35PPLSEE228 pKa = 4.47FEE230 pKa = 4.65LPLIQTPGLSWSVPAIDD247 pKa = 5.57LFLTGPPSPYY257 pKa = 10.44DD258 pKa = 3.54RR259 pKa = 11.84LHH261 pKa = 5.97VWSSPQALQRR271 pKa = 11.84FLHH274 pKa = 6.92DD275 pKa = 3.76PTLTWSEE282 pKa = 3.97LVASGKK288 pKa = 10.09LRR290 pKa = 11.84LDD292 pKa = 3.72SPLKK296 pKa = 10.66LQLLEE301 pKa = 4.42NEE303 pKa = 4.0WLSRR307 pKa = 11.84LFF309 pKa = 3.92
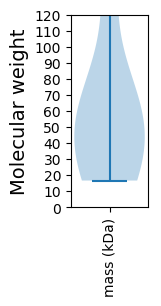
Molecular weight: 34.33 kDa
Isoelectric point according different methods:
Protein with the highest isoelectric point:
>tr|Q77YG2|Q77YG2_BLV Env polyprotein OS=Bovine leukemia virus OX=11901 GN=env PE=4 SV=1
MM1 pKa = 7.34PKK3 pKa = 9.71EE4 pKa = 3.67RR5 pKa = 11.84RR6 pKa = 11.84SRR8 pKa = 11.84RR9 pKa = 11.84RR10 pKa = 11.84PQPIIRR16 pKa = 11.84WQVLLVGGPTLYY28 pKa = 10.24MPARR32 pKa = 11.84PWFCPMMSPSMPGAPSAGPMNDD54 pKa = 3.53SNSKK58 pKa = 10.42GSTPRR63 pKa = 11.84SPARR67 pKa = 11.84PTVSPGPPMDD77 pKa = 5.52DD78 pKa = 3.81LLASMEE84 pKa = 4.35HH85 pKa = 6.83CSLDD89 pKa = 3.7CMSPRR94 pKa = 11.84PAPKK98 pKa = 10.57GPDD101 pKa = 3.56DD102 pKa = 4.58SGSTAPFRR110 pKa = 11.84PFALSPARR118 pKa = 11.84FHH120 pKa = 6.85FPPSSSPPSSPTNANCPRR138 pKa = 11.84PLATVAPSSGTAFFPGTTT156 pKa = 3.63
MM1 pKa = 7.34PKK3 pKa = 9.71EE4 pKa = 3.67RR5 pKa = 11.84RR6 pKa = 11.84SRR8 pKa = 11.84RR9 pKa = 11.84RR10 pKa = 11.84PQPIIRR16 pKa = 11.84WQVLLVGGPTLYY28 pKa = 10.24MPARR32 pKa = 11.84PWFCPMMSPSMPGAPSAGPMNDD54 pKa = 3.53SNSKK58 pKa = 10.42GSTPRR63 pKa = 11.84SPARR67 pKa = 11.84PTVSPGPPMDD77 pKa = 5.52DD78 pKa = 3.81LLASMEE84 pKa = 4.35HH85 pKa = 6.83CSLDD89 pKa = 3.7CMSPRR94 pKa = 11.84PAPKK98 pKa = 10.57GPDD101 pKa = 3.56DD102 pKa = 4.58SGSTAPFRR110 pKa = 11.84PFALSPARR118 pKa = 11.84FHH120 pKa = 6.85FPPSSSPPSSPTNANCPRR138 pKa = 11.84PLATVAPSSGTAFFPGTTT156 pKa = 3.63
Molecular weight: 16.58 kDa
Isoelectric point according different methods:
Peptides (in silico digests for buttom-up proteomics)
Below you can find in silico digests of the whole proteome with Trypsin, Chymotrypsin, Trypsin+LysC, LysN, ArgC proteases suitable for different mass spec machines.| Try ESI |
 |
|---|
| ChTry ESI |
 |
|---|
| ArgC ESI |
 |
|---|
| LysN ESI |
 |
|---|
| TryLysC ESI |
 |
|---|
| Try MALDI |
 |
|---|
| ChTry MALDI |
 |
|---|
| ArgC MALDI |
 |
|---|
| LysN MALDI |
 |
|---|
| TryLysC MALDI |
 |
|---|
| Try LTQ |
 |
|---|
| ChTry LTQ |
 |
|---|
| ArgC LTQ |
 |
|---|
| LysN LTQ |
 |
|---|
| TryLysC LTQ |
 |
|---|
| Try MSlow |
 |
|---|
| ChTry MSlow |
 |
|---|
| ArgC MSlow |
 |
|---|
| LysN MSlow |
 |
|---|
| TryLysC MSlow |
 |
|---|
| Try MShigh |
 |
|---|
| ChTry MShigh |
 |
|---|
| ArgC MShigh |
 |
|---|
| LysN MShigh |
 |
|---|
| TryLysC MShigh |
 |
|---|
General Statistics
Number of major isoforms |
Number of additional isoforms |
Number of all proteins |
Number of amino acids |
Min. Seq. Length |
Max. Seq. Length |
Avg. Seq. Length |
Avg. Mol. Weight |
|---|---|---|---|---|---|---|---|
0 |
3362 |
156 |
1417 |
560.3 |
61.97 |
Amino acid frequency
Ala |
Cys |
Asp |
Glu |
Phe |
Gly |
His |
Ile |
Lys |
Leu |
|---|---|---|---|---|---|---|---|---|---|
7.852 ± 0.555 | 2.052 ± 0.326 |
3.867 ± 0.113 | 3.688 ± 0.336 |
2.855 ± 0.396 | 5.711 ± 0.346 |
2.439 ± 0.244 | 4.7 ± 0.35 |
3.48 ± 0.508 | 11.957 ± 0.918 |
Met |
Asn |
Gln |
Pro |
Arg |
Ser |
Thr |
Val |
Trp |
Tyr |
|---|---|---|---|---|---|---|---|---|---|
0.952 ± 0.347 | 4.164 ± 0.255 |
12.255 ± 0.983 | 6.246 ± 0.503 |
5.473 ± 0.287 | 7.466 ± 0.546 |
5.413 ± 0.149 | 4.521 ± 0.197 |
2.677 ± 0.206 | 2.231 ± 0.276 |
Most of the basic statistics you can see at this page can be downloaded from this CSV file
Proteome-pI is available under Creative Commons Attribution-NoDerivs license, for more details see here
| Reference: Kozlowski LP. Proteome-pI 2.0: Proteome Isoelectric Point Database Update. Nucleic Acids Res. 2021, doi: 10.1093/nar/gkab944 | Contact: Lukasz P. Kozlowski |
