Verrucomicrobiae bacterium DG1235
Taxonomy: cellular organisms; Bacteria; PVC group; Verrucomicrobia; Verrucomicrobiae; unclassified Verrucomicrobiae
Average proteome isoelectric point is 6.09
Get precalculated fractions of proteins

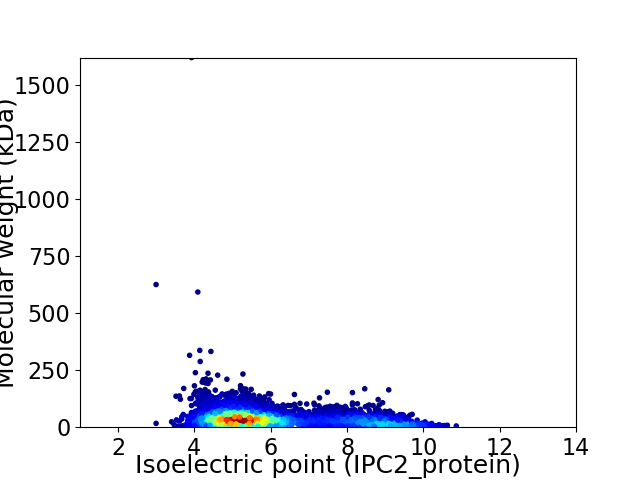
Virtual 2D-PAGE plot for 4883 proteins (isoelectric point calculated using IPC2_protein)
Get csv file with sequences according to given criteria:
* You can choose from 21 different methods for calculating isoelectric point
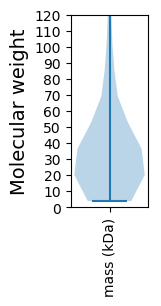
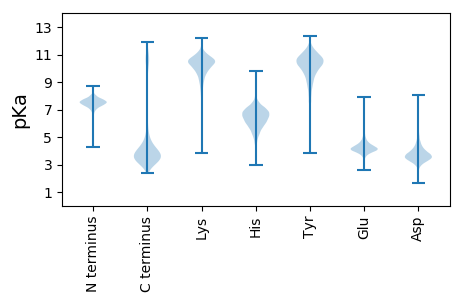
Summary statistics related to proteome-wise predictions


Protein with the lowest isoelectric point:
>tr|B5JDM4|B5JDM4_9BACT 4Fe-4S binding domain protein OS=Verrucomicrobiae bacterium DG1235 OX=382464 GN=VDG1235_3466 PE=4 SV=1
MM1 pKa = 7.57EE2 pKa = 5.42PWQDD6 pKa = 3.62YY7 pKa = 10.57SHH9 pKa = 7.66LDD11 pKa = 3.41PSAVPGVTPWTSQLDD26 pKa = 3.55ADD28 pKa = 4.78LAGATPSAPTITNPFPGLTEE48 pKa = 3.51WRR50 pKa = 11.84YY51 pKa = 10.21DD52 pKa = 3.55LVGAGVAQFVVGNYY66 pKa = 9.45SVFDD70 pKa = 3.88SVEE73 pKa = 4.46SIALTITKK81 pKa = 10.06KK82 pKa = 9.78DD83 pKa = 3.67TQPLGVFQWTLFLAGNYY100 pKa = 8.93IYY102 pKa = 10.9NSSAPIGLPEE112 pKa = 4.64LMNVPIVNNSGVTEE126 pKa = 4.09YY127 pKa = 11.51VDD129 pKa = 3.53LAGPGFSLFGYY140 pKa = 8.51VAGVFGEE147 pKa = 4.15VDD149 pKa = 3.19TGSGSDD155 pKa = 3.94LPNLPGIISQIEE167 pKa = 4.09SGAVSFDD174 pKa = 2.95GSYY177 pKa = 9.58VAGYY181 pKa = 9.73FMKK184 pKa = 10.68QSADD188 pKa = 3.07GDD190 pKa = 4.06FIDD193 pKa = 5.66ANFNGQYY200 pKa = 9.86PIEE203 pKa = 5.0ASDD206 pKa = 3.99VPDD209 pKa = 3.86SGSTAVLAALGLVSLLFVRR228 pKa = 11.84RR229 pKa = 11.84SIKK232 pKa = 9.72WIRR235 pKa = 3.26
MM1 pKa = 7.57EE2 pKa = 5.42PWQDD6 pKa = 3.62YY7 pKa = 10.57SHH9 pKa = 7.66LDD11 pKa = 3.41PSAVPGVTPWTSQLDD26 pKa = 3.55ADD28 pKa = 4.78LAGATPSAPTITNPFPGLTEE48 pKa = 3.51WRR50 pKa = 11.84YY51 pKa = 10.21DD52 pKa = 3.55LVGAGVAQFVVGNYY66 pKa = 9.45SVFDD70 pKa = 3.88SVEE73 pKa = 4.46SIALTITKK81 pKa = 10.06KK82 pKa = 9.78DD83 pKa = 3.67TQPLGVFQWTLFLAGNYY100 pKa = 8.93IYY102 pKa = 10.9NSSAPIGLPEE112 pKa = 4.64LMNVPIVNNSGVTEE126 pKa = 4.09YY127 pKa = 11.51VDD129 pKa = 3.53LAGPGFSLFGYY140 pKa = 8.51VAGVFGEE147 pKa = 4.15VDD149 pKa = 3.19TGSGSDD155 pKa = 3.94LPNLPGIISQIEE167 pKa = 4.09SGAVSFDD174 pKa = 2.95GSYY177 pKa = 9.58VAGYY181 pKa = 9.73FMKK184 pKa = 10.68QSADD188 pKa = 3.07GDD190 pKa = 4.06FIDD193 pKa = 5.66ANFNGQYY200 pKa = 9.86PIEE203 pKa = 5.0ASDD206 pKa = 3.99VPDD209 pKa = 3.86SGSTAVLAALGLVSLLFVRR228 pKa = 11.84RR229 pKa = 11.84SIKK232 pKa = 9.72WIRR235 pKa = 3.26
Molecular weight: 24.93 kDa
Isoelectric point according different methods:
Protein with the highest isoelectric point:
>tr|B5JDE6|B5JDE6_9BACT ATPase histidine kinase- DNA gyrase B- and HSP90-like domain protein OS=Verrucomicrobiae bacterium DG1235 OX=382464 GN=VDG1235_1967 PE=4 SV=1
MM1 pKa = 7.42SALASDD7 pKa = 4.55IIRR10 pKa = 11.84YY11 pKa = 9.09ARR13 pKa = 11.84GAKK16 pKa = 8.91IQRR19 pKa = 11.84FRR21 pKa = 11.84YY22 pKa = 8.74CRR24 pKa = 11.84RR25 pKa = 11.84PANPNSPHH33 pKa = 6.58AALSAAIAALKK44 pKa = 10.92AEE46 pKa = 4.2LRR48 pKa = 11.84LANSRR53 pKa = 11.84PICQTSAAEE62 pKa = 4.05LLKK65 pKa = 10.74EE66 pKa = 4.07LAALGHH72 pKa = 5.65QPPCQGHH79 pKa = 5.24TEE81 pKa = 4.05QKK83 pKa = 10.32LAAQIVNRR91 pKa = 11.84ALLEE95 pKa = 3.9IRR97 pKa = 4.4
MM1 pKa = 7.42SALASDD7 pKa = 4.55IIRR10 pKa = 11.84YY11 pKa = 9.09ARR13 pKa = 11.84GAKK16 pKa = 8.91IQRR19 pKa = 11.84FRR21 pKa = 11.84YY22 pKa = 8.74CRR24 pKa = 11.84RR25 pKa = 11.84PANPNSPHH33 pKa = 6.58AALSAAIAALKK44 pKa = 10.92AEE46 pKa = 4.2LRR48 pKa = 11.84LANSRR53 pKa = 11.84PICQTSAAEE62 pKa = 4.05LLKK65 pKa = 10.74EE66 pKa = 4.07LAALGHH72 pKa = 5.65QPPCQGHH79 pKa = 5.24TEE81 pKa = 4.05QKK83 pKa = 10.32LAAQIVNRR91 pKa = 11.84ALLEE95 pKa = 3.9IRR97 pKa = 4.4
Molecular weight: 10.55 kDa
Isoelectric point according different methods:
Peptides (in silico digests for buttom-up proteomics)
Below you can find in silico digests of the whole proteome with Trypsin, Chymotrypsin, Trypsin+LysC, LysN, ArgC proteases suitable for different mass spec machines.| Try ESI |
 |
|---|
| ChTry ESI |
 |
|---|
| ArgC ESI |
 |
|---|
| LysN ESI |
 |
|---|
| TryLysC ESI |
 |
|---|
| Try MALDI |
 |
|---|
| ChTry MALDI |
 |
|---|
| ArgC MALDI |
 |
|---|
| LysN MALDI |
 |
|---|
| TryLysC MALDI |
 |
|---|
| Try LTQ |
 |
|---|
| ChTry LTQ |
 |
|---|
| ArgC LTQ |
 |
|---|
| LysN LTQ |
 |
|---|
| TryLysC LTQ |
 |
|---|
| Try MSlow |
 |
|---|
| ChTry MSlow |
 |
|---|
| ArgC MSlow |
 |
|---|
| LysN MSlow |
 |
|---|
| TryLysC MSlow |
 |
|---|
| Try MShigh |
 |
|---|
| ChTry MShigh |
 |
|---|
| ArgC MShigh |
 |
|---|
| LysN MShigh |
 |
|---|
| TryLysC MShigh |
 |
|---|
General Statistics
Number of major isoforms |
Number of additional isoforms |
Number of all proteins |
Number of amino acids |
Min. Seq. Length |
Max. Seq. Length |
Avg. Seq. Length |
Avg. Mol. Weight |
|---|---|---|---|---|---|---|---|
0 |
1699424 |
37 |
15483 |
348.0 |
38.5 |
Amino acid frequency
Ala |
Cys |
Asp |
Glu |
Phe |
Gly |
His |
Ile |
Lys |
Leu |
|---|---|---|---|---|---|---|---|---|---|
9.026 ± 0.035 | 0.904 ± 0.017 |
5.882 ± 0.048 | 7.062 ± 0.042 |
4.429 ± 0.021 | 7.626 ± 0.053 |
1.904 ± 0.024 | 5.8 ± 0.032 |
4.586 ± 0.049 | 10.081 ± 0.053 |
Met |
Asn |
Gln |
Pro |
Arg |
Ser |
Thr |
Val |
Trp |
Tyr |
|---|---|---|---|---|---|---|---|---|---|
2.05 ± 0.022 | 3.666 ± 0.03 |
4.461 ± 0.029 | 3.358 ± 0.023 |
5.607 ± 0.043 | 7.267 ± 0.04 |
5.265 ± 0.065 | 6.615 ± 0.039 |
1.461 ± 0.02 | 2.947 ± 0.025 |
Most of the basic statistics you can see at this page can be downloaded from this CSV file
Proteome-pI is available under Creative Commons Attribution-NoDerivs license, for more details see here
| Reference: Kozlowski LP. Proteome-pI 2.0: Proteome Isoelectric Point Database Update. Nucleic Acids Res. 2021, doi: 10.1093/nar/gkab944 | Contact: Lukasz P. Kozlowski |
