Clostridium sp. CT7
Taxonomy: cellular organisms; Bacteria; Terrabacteria group; Firmicutes; Clostridia; Eubacteriales; Clostridiaceae; Clostridium; unclassified Clostridium
Average proteome isoelectric point is 6.99
Get precalculated fractions of proteins
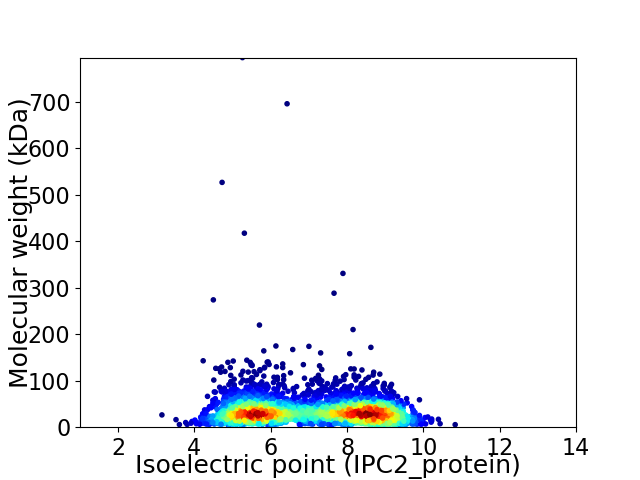
Virtual 2D-PAGE plot for 4078 proteins (isoelectric point calculated using IPC2_protein)
Get csv file with sequences according to given criteria:
* You can choose from 21 different methods for calculating isoelectric point
Summary statistics related to proteome-wise predictions

Protein with the lowest isoelectric point:
>tr|A0A2M8T7Q0|A0A2M8T7Q0_9CLOT Uncharacterized protein OS=Clostridium sp. CT7 OX=2052574 GN=CUB90_03675 PE=4 SV=1
MM1 pKa = 7.5KK2 pKa = 10.22KK3 pKa = 9.99YY4 pKa = 9.92VCVVCGYY11 pKa = 10.11IYY13 pKa = 10.67DD14 pKa = 4.23PAEE17 pKa = 4.34GDD19 pKa = 3.65PDD21 pKa = 4.21NGVQPGTSFEE31 pKa = 4.87NIPDD35 pKa = 3.65DD36 pKa = 3.92WTCPLCGVGKK46 pKa = 9.96DD47 pKa = 3.61QFEE50 pKa = 4.41EE51 pKa = 4.14AQEE54 pKa = 3.91
MM1 pKa = 7.5KK2 pKa = 10.22KK3 pKa = 9.99YY4 pKa = 9.92VCVVCGYY11 pKa = 10.11IYY13 pKa = 10.67DD14 pKa = 4.23PAEE17 pKa = 4.34GDD19 pKa = 3.65PDD21 pKa = 4.21NGVQPGTSFEE31 pKa = 4.87NIPDD35 pKa = 3.65DD36 pKa = 3.92WTCPLCGVGKK46 pKa = 9.96DD47 pKa = 3.61QFEE50 pKa = 4.41EE51 pKa = 4.14AQEE54 pKa = 3.91
Molecular weight: 5.96 kDa
Isoelectric point according different methods:
Protein with the highest isoelectric point:
>tr|A0A2M8T6K9|A0A2M8T6K9_9CLOT tRNA(Met) cytidine acetate ligase OS=Clostridium sp. CT7 OX=2052574 GN=tmcAL PE=3 SV=1
MM1 pKa = 7.48SRR3 pKa = 11.84KK4 pKa = 9.55CDD6 pKa = 3.06ICGKK10 pKa = 10.14GLVAGVQYY18 pKa = 10.89SHH20 pKa = 6.55SHH22 pKa = 5.37RR23 pKa = 11.84QSKK26 pKa = 7.96RR27 pKa = 11.84TWLPNIRR34 pKa = 11.84KK35 pKa = 9.04IKK37 pKa = 10.35AVVDD41 pKa = 3.91GTPKK45 pKa = 9.94TIHH48 pKa = 5.48VCTRR52 pKa = 11.84CLRR55 pKa = 11.84SGKK58 pKa = 7.45VQRR61 pKa = 11.84ALL63 pKa = 3.45
MM1 pKa = 7.48SRR3 pKa = 11.84KK4 pKa = 9.55CDD6 pKa = 3.06ICGKK10 pKa = 10.14GLVAGVQYY18 pKa = 10.89SHH20 pKa = 6.55SHH22 pKa = 5.37RR23 pKa = 11.84QSKK26 pKa = 7.96RR27 pKa = 11.84TWLPNIRR34 pKa = 11.84KK35 pKa = 9.04IKK37 pKa = 10.35AVVDD41 pKa = 3.91GTPKK45 pKa = 9.94TIHH48 pKa = 5.48VCTRR52 pKa = 11.84CLRR55 pKa = 11.84SGKK58 pKa = 7.45VQRR61 pKa = 11.84ALL63 pKa = 3.45
Molecular weight: 7.07 kDa
Isoelectric point according different methods:
Peptides (in silico digests for buttom-up proteomics)
Below you can find in silico digests of the whole proteome with Trypsin, Chymotrypsin, Trypsin+LysC, LysN, ArgC proteases suitable for different mass spec machines.| Try ESI |
 |
|---|
| ChTry ESI |
|
|---|
| ArgC ESI |
|
|---|
| LysN ESI |
|
|---|
| TryLysC ESI |
|
|---|
| Try MALDI |
|
|---|
| ChTry MALDI |
|
|---|
| ArgC MALDI |
|
|---|
| LysN MALDI |
|
|---|
| TryLysC MALDI |
|
|---|
| Try LTQ |
|
|---|
| ChTry LTQ |
|
|---|
| ArgC LTQ |
|
|---|
| LysN LTQ |
|
|---|
| TryLysC LTQ |
|
|---|
| Try MSlow |
|
|---|
| ChTry MSlow |
|
|---|
| ArgC MSlow |
|
|---|
| LysN MSlow |
|
|---|
| TryLysC MSlow |
|
|---|
| Try MShigh |
|
|---|
| ChTry MShigh |
|
|---|
| ArgC MShigh |
|
|---|
| LysN MShigh |
|
|---|
| TryLysC MShigh |
|
|---|
General Statistics
Number of major isoforms |
Number of additional isoforms |
Number of all proteins |
Number of amino acids |
Min. Seq. Length |
Max. Seq. Length |
Avg. Seq. Length |
Avg. Mol. Weight |
|---|---|---|---|---|---|---|---|
0 |
1301812 |
25 |
6883 |
319.2 |
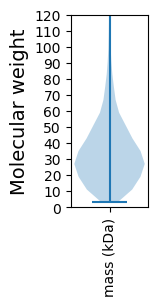
36.02 |
Amino acid frequency
Ala |
Cys |
Asp |
Glu |
Phe |
Gly |
His |
Ile |
Lys |
Leu |
|---|---|---|---|---|---|---|---|---|---|
5.692 ± 0.037 | 1.298 ± 0.014 |
5.636 ± 0.031 | 6.545 ± 0.05 |
4.501 ± 0.03 | 6.303 ± 0.041 |
1.359 ± 0.014 | 9.707 ± 0.043 |
9.56 ± 0.04 | 8.603 ± 0.042 |
Met |
Asn |
Gln |
Pro |
Arg |
Ser |
Thr |
Val |
Trp |
Tyr |
|---|---|---|---|---|---|---|---|---|---|
2.702 ± 0.019 | 6.654 ± 0.041 |
2.728 ± 0.022 | 2.262 ± 0.02 |
3.191 ± 0.025 | 6.764 ± 0.039 |
4.911 ± 0.036 | 6.57 ± 0.03 |
0.729 ± 0.011 | 4.284 ± 0.027 |
Most of the basic statistics you can see at this page can be downloaded from this CSV file
See this proteome in:

Proteome-pI is available under Creative Commons Attribution-NoDerivs license, for more details see here
| Reference: Kozlowski LP. Proteome-pI 2.0: Proteome Isoelectric Point Database Update. Nucleic Acids Res. 2021, doi: 10.1093/nar/gkab944 | Contact: Lukasz P. Kozlowski |