Stenotrophomonas maltophilia (strain K279a)
Taxonomy: cellular organisms; Bacteria; Proteobacteria; Gammaproteobacteria; Xanthomonadales; Xanthomonadaceae; Stenotrophomonas; Stenotrophomonas maltophilia group; Stenotrophomonas maltophilia
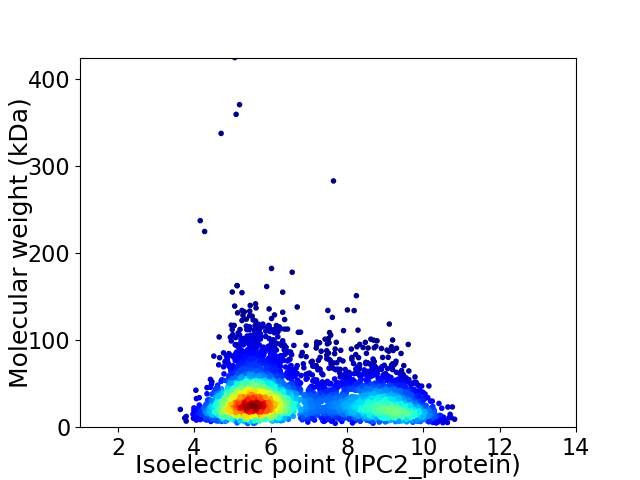
Average proteome isoelectric point is 6.75
Get precalculated fractions of proteins

Virtual 2D-PAGE plot for 4365 proteins (isoelectric point calculated using IPC2_protein)
Get csv file with sequences according to given criteria:
* You can choose from 21 different methods for calculating isoelectric point
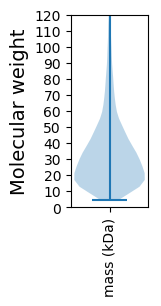
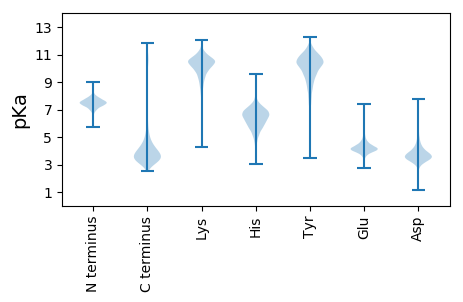
Summary statistics related to proteome-wise predictions


Protein with the lowest isoelectric point:
>tr|B2FSK9|B2FSK9_STRMK Putative ABC transporter ATP-binding protein OS=Stenotrophomonas maltophilia (strain K279a) OX=522373 GN=Smlt1185 PE=4 SV=1
MM1 pKa = 7.14NLVDD5 pKa = 4.97RR6 pKa = 11.84FLSGLIPRR14 pKa = 11.84LPADD18 pKa = 5.3DD19 pKa = 4.44APQWAHH25 pKa = 4.92VQGASAEE32 pKa = 4.03DD33 pKa = 3.74LQRR36 pKa = 11.84LRR38 pKa = 11.84MQWPQVPDD46 pKa = 3.56SLVEE50 pKa = 3.79LLSRR54 pKa = 11.84VDD56 pKa = 3.29GTHH59 pKa = 5.14FRR61 pKa = 11.84EE62 pKa = 4.32YY63 pKa = 10.02PGGGVCVLMLGSDD76 pKa = 4.07VEE78 pKa = 4.68DD79 pKa = 3.68GGYY82 pKa = 9.77PYY84 pKa = 10.97YY85 pKa = 10.55LRR87 pKa = 11.84SVAQIFEE94 pKa = 4.72DD95 pKa = 3.61QQQWDD100 pKa = 3.52DD101 pKa = 4.29SIRR104 pKa = 11.84SIYY107 pKa = 9.47EE108 pKa = 3.32EE109 pKa = 4.08WLDD112 pKa = 4.85DD113 pKa = 3.82EE114 pKa = 5.18PEE116 pKa = 4.01ILGEE120 pKa = 5.11GIDD123 pKa = 5.01ADD125 pKa = 3.93LPMNRR130 pKa = 11.84RR131 pKa = 11.84LCFSHH136 pKa = 6.69CMNNGGTSMLYY147 pKa = 10.57LDD149 pKa = 5.5FNPAPGGTVGQVVRR163 pKa = 11.84YY164 pKa = 9.01LHH166 pKa = 7.24DD167 pKa = 5.09PDD169 pKa = 4.6SYY171 pKa = 12.0AVIAPSFDD179 pKa = 4.49AYY181 pKa = 10.67LQQLIDD187 pKa = 3.61GGYY190 pKa = 10.42AFIDD194 pKa = 3.85EE195 pKa = 4.52EE196 pKa = 4.34QQ197 pKa = 3.2
MM1 pKa = 7.14NLVDD5 pKa = 4.97RR6 pKa = 11.84FLSGLIPRR14 pKa = 11.84LPADD18 pKa = 5.3DD19 pKa = 4.44APQWAHH25 pKa = 4.92VQGASAEE32 pKa = 4.03DD33 pKa = 3.74LQRR36 pKa = 11.84LRR38 pKa = 11.84MQWPQVPDD46 pKa = 3.56SLVEE50 pKa = 3.79LLSRR54 pKa = 11.84VDD56 pKa = 3.29GTHH59 pKa = 5.14FRR61 pKa = 11.84EE62 pKa = 4.32YY63 pKa = 10.02PGGGVCVLMLGSDD76 pKa = 4.07VEE78 pKa = 4.68DD79 pKa = 3.68GGYY82 pKa = 9.77PYY84 pKa = 10.97YY85 pKa = 10.55LRR87 pKa = 11.84SVAQIFEE94 pKa = 4.72DD95 pKa = 3.61QQQWDD100 pKa = 3.52DD101 pKa = 4.29SIRR104 pKa = 11.84SIYY107 pKa = 9.47EE108 pKa = 3.32EE109 pKa = 4.08WLDD112 pKa = 4.85DD113 pKa = 3.82EE114 pKa = 5.18PEE116 pKa = 4.01ILGEE120 pKa = 5.11GIDD123 pKa = 5.01ADD125 pKa = 3.93LPMNRR130 pKa = 11.84RR131 pKa = 11.84LCFSHH136 pKa = 6.69CMNNGGTSMLYY147 pKa = 10.57LDD149 pKa = 5.5FNPAPGGTVGQVVRR163 pKa = 11.84YY164 pKa = 9.01LHH166 pKa = 7.24DD167 pKa = 5.09PDD169 pKa = 4.6SYY171 pKa = 12.0AVIAPSFDD179 pKa = 4.49AYY181 pKa = 10.67LQQLIDD187 pKa = 3.61GGYY190 pKa = 10.42AFIDD194 pKa = 3.85EE195 pKa = 4.52EE196 pKa = 4.34QQ197 pKa = 3.2
Molecular weight: 22.16 kDa
Isoelectric point according different methods:
Protein with the highest isoelectric point:
>sp|B2FN90|IF2_STRMK Translation initiation factor IF-2 OS=Stenotrophomonas maltophilia (strain K279a) OX=522373 GN=infB PE=3 SV=1
MM1 pKa = 7.64WPRR4 pKa = 11.84AFAGTVAGFLLAAAATGLLAWVPPGPWQRR33 pKa = 11.84ALVPTLIAFIPLWMLAALWAFSFRR57 pKa = 11.84SALRR61 pKa = 11.84AWLVLGGSAAAGFAMLGLLRR81 pKa = 11.84LTGAVQQ87 pKa = 3.12
MM1 pKa = 7.64WPRR4 pKa = 11.84AFAGTVAGFLLAAAATGLLAWVPPGPWQRR33 pKa = 11.84ALVPTLIAFIPLWMLAALWAFSFRR57 pKa = 11.84SALRR61 pKa = 11.84AWLVLGGSAAAGFAMLGLLRR81 pKa = 11.84LTGAVQQ87 pKa = 3.12
Molecular weight: 9.17 kDa
Isoelectric point according different methods:
Peptides (in silico digests for buttom-up proteomics)
Below you can find in silico digests of the whole proteome with Trypsin, Chymotrypsin, Trypsin+LysC, LysN, ArgC proteases suitable for different mass spec machines.| Try ESI |
 |
|---|
| ChTry ESI |
 |
|---|
| ArgC ESI |
 |
|---|
| LysN ESI |
 |
|---|
| TryLysC ESI |
 |
|---|
| Try MALDI |
 |
|---|
| ChTry MALDI |
 |
|---|
| ArgC MALDI |
 |
|---|
| LysN MALDI |
 |
|---|
| TryLysC MALDI |
 |
|---|
| Try LTQ |
 |
|---|
| ChTry LTQ |
 |
|---|
| ArgC LTQ |
 |
|---|
| LysN LTQ |
 |
|---|
| TryLysC LTQ |
 |
|---|
| Try MSlow |
 |
|---|
| ChTry MSlow |
 |
|---|
| ArgC MSlow |
 |
|---|
| LysN MSlow |
 |
|---|
| TryLysC MSlow |
 |
|---|
| Try MShigh |
 |
|---|
| ChTry MShigh |
 |
|---|
| ArgC MShigh |
 |
|---|
| LysN MShigh |
 |
|---|
| TryLysC MShigh |
 |
|---|
General Statistics
Number of major isoforms |
Number of additional isoforms |
Number of all proteins |
Number of amino acids |
Min. Seq. Length |
Max. Seq. Length |
Avg. Seq. Length |
Avg. Mol. Weight |
|---|---|---|---|---|---|---|---|
0 |
1427787 |
38 |
4127 |
327.1 |
35.51 |
Amino acid frequency
Ala |
Cys |
Asp |
Glu |
Phe |
Gly |
His |
Ile |
Lys |
Leu |
|---|---|---|---|---|---|---|---|---|---|
12.875 ± 0.054 | 0.823 ± 0.013 |
5.675 ± 0.031 | 5.065 ± 0.036 |
3.268 ± 0.027 | 8.626 ± 0.062 |
2.245 ± 0.021 | 4.015 ± 0.028 |
2.686 ± 0.032 | 11.034 ± 0.054 |
Met |
Asn |
Gln |
Pro |
Arg |
Ser |
Thr |
Val |
Trp |
Tyr |
|---|---|---|---|---|---|---|---|---|---|
2.203 ± 0.018 | 2.638 ± 0.037 |
5.335 ± 0.038 | 4.407 ± 0.029 |
7.475 ± 0.042 | 5.434 ± 0.03 |
4.923 ± 0.039 | 7.371 ± 0.033 |
1.609 ± 0.018 | 2.294 ± 0.024 |
Most of the basic statistics you can see at this page can be downloaded from this CSV file
Proteome-pI is available under Creative Commons Attribution-NoDerivs license, for more details see here
| Reference: Kozlowski LP. Proteome-pI 2.0: Proteome Isoelectric Point Database Update. Nucleic Acids Res. 2021, doi: 10.1093/nar/gkab944 | Contact: Lukasz P. Kozlowski |
