Pseudomonas phage phiKMV
Taxonomy: Viruses; Duplodnaviria; Heunggongvirae; Uroviricota; Caudoviricetes; Caudovirales; Autographiviridae; Krylovirinae; Phikmvvirus; Pseudomonas virus phiKMV
Average proteome isoelectric point is 6.85
Get precalculated fractions of proteins

Virtual 2D-PAGE plot for 49 proteins (isoelectric point calculated using IPC2_protein)
Get csv file with sequences according to given criteria:
* You can choose from 21 different methods for calculating isoelectric point
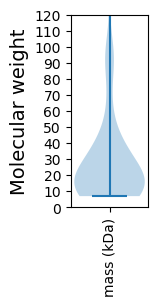
Summary statistics related to proteome-wise predictions


Protein with the lowest isoelectric point:
>tr|Q7Y2C8|Q7Y2C8_BPKMV Internal core protein OS=Pseudomonas phage phiKMV OX=204270 GN=gp37 PE=4 SV=1
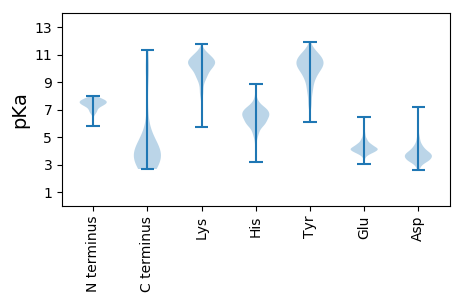
MM1 pKa = 7.52ARR3 pKa = 11.84FKK5 pKa = 11.05NPEE8 pKa = 4.31TIHH11 pKa = 6.06VADD14 pKa = 3.82GVEE17 pKa = 4.42AVFSLDD23 pKa = 3.36FPFLRR28 pKa = 11.84RR29 pKa = 11.84EE30 pKa = 4.09DD31 pKa = 3.59VFVQVDD37 pKa = 4.16KK38 pKa = 11.22ILTTDD43 pKa = 3.65YY44 pKa = 10.74TWVDD48 pKa = 3.16NTNIQLAVVPKK59 pKa = 9.93KK60 pKa = 10.33DD61 pKa = 3.18QEE63 pKa = 4.01VRR65 pKa = 11.84IFRR68 pKa = 11.84DD69 pKa = 3.52TPAQVPDD76 pKa = 3.7TQFSQGIPFLPRR88 pKa = 11.84YY89 pKa = 9.44IDD91 pKa = 3.78ANNKK95 pKa = 7.73QLLYY99 pKa = 10.69AVQEE103 pKa = 4.83GINTANLALDD113 pKa = 4.02GVLDD117 pKa = 5.11AIRR120 pKa = 11.84IAEE123 pKa = 4.12EE124 pKa = 3.63ARR126 pKa = 11.84RR127 pKa = 11.84LAQEE131 pKa = 4.42ALDD134 pKa = 4.19AANEE138 pKa = 4.02ALRR141 pKa = 11.84RR142 pKa = 11.84ALGFAEE148 pKa = 3.77IRR150 pKa = 11.84TVTEE154 pKa = 4.95DD155 pKa = 3.95SDD157 pKa = 4.62IDD159 pKa = 4.09PSWRR163 pKa = 11.84GYY165 pKa = 7.33WNRR168 pKa = 11.84CITSEE173 pKa = 4.27QSLTLTMQMEE183 pKa = 4.91DD184 pKa = 3.93PDD186 pKa = 4.2EE187 pKa = 4.22PWIEE191 pKa = 3.83FSEE194 pKa = 4.42VHH196 pKa = 6.29FEE198 pKa = 3.83QAGIRR203 pKa = 11.84DD204 pKa = 4.21LNIVAGPGVTINRR217 pKa = 11.84LQNTTMQLYY226 pKa = 10.33GEE228 pKa = 4.7NGVCTLKK235 pKa = 10.97RR236 pKa = 11.84LGPNHH241 pKa = 7.1WIIFGAMEE249 pKa = 5.38DD250 pKa = 3.93DD251 pKa = 3.73
MM1 pKa = 7.52ARR3 pKa = 11.84FKK5 pKa = 11.05NPEE8 pKa = 4.31TIHH11 pKa = 6.06VADD14 pKa = 3.82GVEE17 pKa = 4.42AVFSLDD23 pKa = 3.36FPFLRR28 pKa = 11.84RR29 pKa = 11.84EE30 pKa = 4.09DD31 pKa = 3.59VFVQVDD37 pKa = 4.16KK38 pKa = 11.22ILTTDD43 pKa = 3.65YY44 pKa = 10.74TWVDD48 pKa = 3.16NTNIQLAVVPKK59 pKa = 9.93KK60 pKa = 10.33DD61 pKa = 3.18QEE63 pKa = 4.01VRR65 pKa = 11.84IFRR68 pKa = 11.84DD69 pKa = 3.52TPAQVPDD76 pKa = 3.7TQFSQGIPFLPRR88 pKa = 11.84YY89 pKa = 9.44IDD91 pKa = 3.78ANNKK95 pKa = 7.73QLLYY99 pKa = 10.69AVQEE103 pKa = 4.83GINTANLALDD113 pKa = 4.02GVLDD117 pKa = 5.11AIRR120 pKa = 11.84IAEE123 pKa = 4.12EE124 pKa = 3.63ARR126 pKa = 11.84RR127 pKa = 11.84LAQEE131 pKa = 4.42ALDD134 pKa = 4.19AANEE138 pKa = 4.02ALRR141 pKa = 11.84RR142 pKa = 11.84ALGFAEE148 pKa = 3.77IRR150 pKa = 11.84TVTEE154 pKa = 4.95DD155 pKa = 3.95SDD157 pKa = 4.62IDD159 pKa = 4.09PSWRR163 pKa = 11.84GYY165 pKa = 7.33WNRR168 pKa = 11.84CITSEE173 pKa = 4.27QSLTLTMQMEE183 pKa = 4.91DD184 pKa = 3.93PDD186 pKa = 4.2EE187 pKa = 4.22PWIEE191 pKa = 3.83FSEE194 pKa = 4.42VHH196 pKa = 6.29FEE198 pKa = 3.83QAGIRR203 pKa = 11.84DD204 pKa = 4.21LNIVAGPGVTINRR217 pKa = 11.84LQNTTMQLYY226 pKa = 10.33GEE228 pKa = 4.7NGVCTLKK235 pKa = 10.97RR236 pKa = 11.84LGPNHH241 pKa = 7.1WIIFGAMEE249 pKa = 5.38DD250 pKa = 3.93DD251 pKa = 3.73
Molecular weight: 28.49 kDa
Isoelectric point according different methods:
Protein with the highest isoelectric point:
>sp|Q7Y2C0|ENLYS_BPKMV SAR-endolysin OS=Pseudomonas phage phiKMV OX=204270 GN=45 PE=1 SV=1
MM1 pKa = 7.72PRR3 pKa = 11.84TIVAILVLAVVALGASYY20 pKa = 11.15GFVQSYY26 pKa = 9.26RR27 pKa = 11.84ALGIAQGEE35 pKa = 4.76IKK37 pKa = 10.4RR38 pKa = 11.84QTARR42 pKa = 11.84AEE44 pKa = 4.03ALEE47 pKa = 4.04VRR49 pKa = 11.84YY50 pKa = 8.34ATLQRR55 pKa = 11.84HH56 pKa = 5.04VKK58 pKa = 9.62EE59 pKa = 4.09VAARR63 pKa = 11.84TNTQRR68 pKa = 11.84QEE70 pKa = 3.19VDD72 pKa = 2.73RR73 pKa = 11.84ALDD76 pKa = 3.59QNRR79 pKa = 11.84PWADD83 pKa = 3.33RR84 pKa = 11.84PVPAAVVDD92 pKa = 4.23SLCNRR97 pKa = 11.84PGARR101 pKa = 11.84CAVRR105 pKa = 11.84TPTDD109 pKa = 2.88
MM1 pKa = 7.72PRR3 pKa = 11.84TIVAILVLAVVALGASYY20 pKa = 11.15GFVQSYY26 pKa = 9.26RR27 pKa = 11.84ALGIAQGEE35 pKa = 4.76IKK37 pKa = 10.4RR38 pKa = 11.84QTARR42 pKa = 11.84AEE44 pKa = 4.03ALEE47 pKa = 4.04VRR49 pKa = 11.84YY50 pKa = 8.34ATLQRR55 pKa = 11.84HH56 pKa = 5.04VKK58 pKa = 9.62EE59 pKa = 4.09VAARR63 pKa = 11.84TNTQRR68 pKa = 11.84QEE70 pKa = 3.19VDD72 pKa = 2.73RR73 pKa = 11.84ALDD76 pKa = 3.59QNRR79 pKa = 11.84PWADD83 pKa = 3.33RR84 pKa = 11.84PVPAAVVDD92 pKa = 4.23SLCNRR97 pKa = 11.84PGARR101 pKa = 11.84CAVRR105 pKa = 11.84TPTDD109 pKa = 2.88
Molecular weight: 11.98 kDa
Isoelectric point according different methods:
Peptides (in silico digests for buttom-up proteomics)
Below you can find in silico digests of the whole proteome with Trypsin, Chymotrypsin, Trypsin+LysC, LysN, ArgC proteases suitable for different mass spec machines.| Try ESI |
 |
|---|
| ChTry ESI |
 |
|---|
| ArgC ESI |
 |
|---|
| LysN ESI |
 |
|---|
| TryLysC ESI |
 |
|---|
| Try MALDI |
 |
|---|
| ChTry MALDI |
 |
|---|
| ArgC MALDI |
 |
|---|
| LysN MALDI |
 |
|---|
| TryLysC MALDI |
 |
|---|
| Try LTQ |
 |
|---|
| ChTry LTQ |
 |
|---|
| ArgC LTQ |
 |
|---|
| LysN LTQ |
 |
|---|
| TryLysC LTQ |
 |
|---|
| Try MSlow |
 |
|---|
| ChTry MSlow |
 |
|---|
| ArgC MSlow |
 |
|---|
| LysN MSlow |
 |
|---|
| TryLysC MSlow |
 |
|---|
| Try MShigh |
 |
|---|
| ChTry MShigh |
 |
|---|
| ArgC MShigh |
 |
|---|
| LysN MShigh |
 |
|---|
| TryLysC MShigh |
 |
|---|
General Statistics
Number of major isoforms |
Number of additional isoforms |
Number of all proteins |
Number of amino acids |
Min. Seq. Length |
Max. Seq. Length |
Avg. Seq. Length |
Avg. Mol. Weight |
|---|---|---|---|---|---|---|---|
0 |
12973 |
64 |
1337 |
264.8 |
29.28 |
Amino acid frequency
Ala |
Cys |
Asp |
Glu |
Phe |
Gly |
His |
Ile |
Lys |
Leu |
|---|---|---|---|---|---|---|---|---|---|
11.192 ± 0.521 | 1.002 ± 0.171 |
5.874 ± 0.195 | 6.097 ± 0.242 |
3.191 ± 0.162 | 7.909 ± 0.306 |
2.104 ± 0.179 | 4.27 ± 0.228 |
4.679 ± 0.289 | 9.057 ± 0.27 |
Met |
Asn |
Gln |
Pro |
Arg |
Ser |
Thr |
Val |
Trp |
Tyr |
|---|---|---|---|---|---|---|---|---|---|
2.991 ± 0.143 | 3.577 ± 0.224 |
4.61 ± 0.384 | 4.679 ± 0.287 |
6.837 ± 0.315 | 4.887 ± 0.217 |
5.627 ± 0.283 | 6.83 ± 0.264 |
1.588 ± 0.12 | 2.999 ± 0.224 |
Most of the basic statistics you can see at this page can be downloaded from this CSV file
Proteome-pI is available under Creative Commons Attribution-NoDerivs license, for more details see here
| Reference: Kozlowski LP. Proteome-pI 2.0: Proteome Isoelectric Point Database Update. Nucleic Acids Res. 2021, doi: 10.1093/nar/gkab944 | Contact: Lukasz P. Kozlowski |
