Psittacine adenovirus 3
Taxonomy: Viruses; Varidnaviria; Bamfordvirae; Preplasmiviricota; Tectiliviricetes; Rowavirales; Adenoviridae; Atadenovirus; Psittacine atadenovirus A
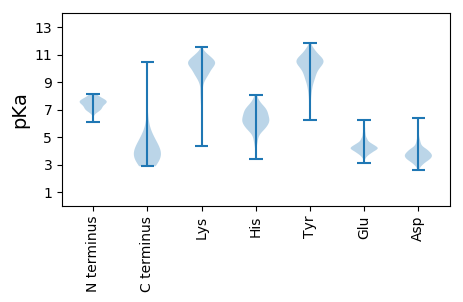
Average proteome isoelectric point is 6.89
Get precalculated fractions of proteins

Virtual 2D-PAGE plot for 29 proteins (isoelectric point calculated using IPC2_protein)
Get csv file with sequences according to given criteria:
* You can choose from 21 different methods for calculating isoelectric point
Summary statistics related to proteome-wise predictions


Protein with the lowest isoelectric point:
>tr|A0A0A7JW93|A0A0A7JW93_9ADEN Uncharacterized protein OS=Psittacine adenovirus 3 OX=1580497 GN=PAV19gp24 PE=4 SV=1
MM1 pKa = 7.01QPAAKK6 pKa = 9.87RR7 pKa = 11.84PRR9 pKa = 11.84DD10 pKa = 3.47EE11 pKa = 4.5SSAVDD16 pKa = 3.45LVYY19 pKa = 10.68PFDD22 pKa = 4.0EE23 pKa = 4.96AVTAPLPPFIDD34 pKa = 3.08VGGGLEE40 pKa = 4.2TEE42 pKa = 4.31GLKK45 pKa = 10.92LSLNVSSPLTLRR57 pKa = 11.84NNAVALKK64 pKa = 9.48IGSGLSVDD72 pKa = 4.14SSGALQAAAAASVSPPLSNSGGTLHH97 pKa = 7.01LSVGSGLTVADD108 pKa = 3.92GALASSLTASPPLSISGDD126 pKa = 3.66TLALAVGNGLAVSGGVLASSLNPAPPLQLLGDD158 pKa = 4.68SISLSLGSGLAVQSGALVSSPAVTAPVTITNGALGLSVGDD198 pKa = 3.53GLTVRR203 pKa = 11.84EE204 pKa = 4.81GSLQAPTEE212 pKa = 4.15MFSAVQGWDD221 pKa = 3.13TLDD224 pKa = 3.47NFSAVNIVSSAGVKK238 pKa = 9.95FPASVFCEE246 pKa = 3.69RR247 pKa = 11.84LNIRR251 pKa = 11.84GLVVCTMALKK261 pKa = 10.7LDD263 pKa = 3.8TSQWSSYY270 pKa = 10.52GSTAPSSDD278 pKa = 3.07FVFRR282 pKa = 11.84LGEE285 pKa = 4.13LFNSGVPSTYY295 pKa = 10.25VPASAGSSYY304 pKa = 9.62LTPHH308 pKa = 6.68GGITTSTTSQSSGYY322 pKa = 9.77VSPEE326 pKa = 3.43GGTVVVFRR334 pKa = 11.84PACSGAWANQFDD346 pKa = 4.21VSQCTIVFPSEE357 pKa = 4.02GGTVLHH363 pKa = 7.1FSLQNKK369 pKa = 9.43SGQTNYY375 pKa = 10.66LFTPGITGTMLIYY388 pKa = 10.1PISFSYY394 pKa = 10.55LAANSLL400 pKa = 3.8
MM1 pKa = 7.01QPAAKK6 pKa = 9.87RR7 pKa = 11.84PRR9 pKa = 11.84DD10 pKa = 3.47EE11 pKa = 4.5SSAVDD16 pKa = 3.45LVYY19 pKa = 10.68PFDD22 pKa = 4.0EE23 pKa = 4.96AVTAPLPPFIDD34 pKa = 3.08VGGGLEE40 pKa = 4.2TEE42 pKa = 4.31GLKK45 pKa = 10.92LSLNVSSPLTLRR57 pKa = 11.84NNAVALKK64 pKa = 9.48IGSGLSVDD72 pKa = 4.14SSGALQAAAAASVSPPLSNSGGTLHH97 pKa = 7.01LSVGSGLTVADD108 pKa = 3.92GALASSLTASPPLSISGDD126 pKa = 3.66TLALAVGNGLAVSGGVLASSLNPAPPLQLLGDD158 pKa = 4.68SISLSLGSGLAVQSGALVSSPAVTAPVTITNGALGLSVGDD198 pKa = 3.53GLTVRR203 pKa = 11.84EE204 pKa = 4.81GSLQAPTEE212 pKa = 4.15MFSAVQGWDD221 pKa = 3.13TLDD224 pKa = 3.47NFSAVNIVSSAGVKK238 pKa = 9.95FPASVFCEE246 pKa = 3.69RR247 pKa = 11.84LNIRR251 pKa = 11.84GLVVCTMALKK261 pKa = 10.7LDD263 pKa = 3.8TSQWSSYY270 pKa = 10.52GSTAPSSDD278 pKa = 3.07FVFRR282 pKa = 11.84LGEE285 pKa = 4.13LFNSGVPSTYY295 pKa = 10.25VPASAGSSYY304 pKa = 9.62LTPHH308 pKa = 6.68GGITTSTTSQSSGYY322 pKa = 9.77VSPEE326 pKa = 3.43GGTVVVFRR334 pKa = 11.84PACSGAWANQFDD346 pKa = 4.21VSQCTIVFPSEE357 pKa = 4.02GGTVLHH363 pKa = 7.1FSLQNKK369 pKa = 9.43SGQTNYY375 pKa = 10.66LFTPGITGTMLIYY388 pKa = 10.1PISFSYY394 pKa = 10.55LAANSLL400 pKa = 3.8
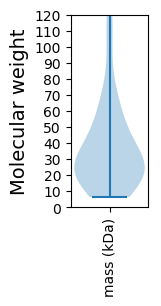
Molecular weight: 40.26 kDa
Isoelectric point according different methods:
Protein with the highest isoelectric point:
>tr|A0A0A7JTS9|A0A0A7JTS9_9ADEN 100K OS=Psittacine adenovirus 3 OX=1580497 GN=PAV19gp15 PE=4 SV=1
MM1 pKa = 8.02RR2 pKa = 11.84KK3 pKa = 8.11RR4 pKa = 11.84TGRR7 pKa = 11.84SRR9 pKa = 11.84RR10 pKa = 11.84KK11 pKa = 9.22RR12 pKa = 11.84LSIVFGRR19 pKa = 11.84PRR21 pKa = 11.84LCRR24 pKa = 11.84SNRR27 pKa = 11.84RR28 pKa = 11.84RR29 pKa = 11.84LKK31 pKa = 10.98GGFLPLLIPLISAAIGAAPAIASTVIAAKK60 pKa = 9.87NARR63 pKa = 11.84RR64 pKa = 11.84HH65 pKa = 4.6
MM1 pKa = 8.02RR2 pKa = 11.84KK3 pKa = 8.11RR4 pKa = 11.84TGRR7 pKa = 11.84SRR9 pKa = 11.84RR10 pKa = 11.84KK11 pKa = 9.22RR12 pKa = 11.84LSIVFGRR19 pKa = 11.84PRR21 pKa = 11.84LCRR24 pKa = 11.84SNRR27 pKa = 11.84RR28 pKa = 11.84RR29 pKa = 11.84LKK31 pKa = 10.98GGFLPLLIPLISAAIGAAPAIASTVIAAKK60 pKa = 9.87NARR63 pKa = 11.84RR64 pKa = 11.84HH65 pKa = 4.6
Molecular weight: 7.23 kDa
Isoelectric point according different methods:
Peptides (in silico digests for buttom-up proteomics)
Below you can find in silico digests of the whole proteome with Trypsin, Chymotrypsin, Trypsin+LysC, LysN, ArgC proteases suitable for different mass spec machines.| Try ESI |
 |
|---|
| ChTry ESI |
 |
|---|
| ArgC ESI |
 |
|---|
| LysN ESI |
 |
|---|
| TryLysC ESI |
 |
|---|
| Try MALDI |
 |
|---|
| ChTry MALDI |
 |
|---|
| ArgC MALDI |
 |
|---|
| LysN MALDI |
 |
|---|
| TryLysC MALDI |
 |
|---|
| Try LTQ |
 |
|---|
| ChTry LTQ |
 |
|---|
| ArgC LTQ |
 |
|---|
| LysN LTQ |
 |
|---|
| TryLysC LTQ |
 |
|---|
| Try MSlow |
 |
|---|
| ChTry MSlow |
 |
|---|
| ArgC MSlow |
 |
|---|
| LysN MSlow |
 |
|---|
| TryLysC MSlow |
 |
|---|
| Try MShigh |
 |
|---|
| ChTry MShigh |
 |
|---|
| ArgC MShigh |
 |
|---|
| LysN MShigh |
 |
|---|
| TryLysC MShigh |
 |
|---|
General Statistics
Number of major isoforms |
Number of additional isoforms |
Number of all proteins |
Number of amino acids |
Min. Seq. Length |
Max. Seq. Length |
Avg. Seq. Length |
Avg. Mol. Weight |
|---|---|---|---|---|---|---|---|
0 |
9690 |
54 |
1077 |
334.1 |
37.23 |
Amino acid frequency
Ala |
Cys |
Asp |
Glu |
Phe |
Gly |
His |
Ile |
Lys |
Leu |
|---|---|---|---|---|---|---|---|---|---|
8.07 ± 0.484 | 2.632 ± 0.436 |
4.933 ± 0.265 | 5.459 ± 0.475 |
3.963 ± 0.208 | 6.347 ± 0.4 |
1.992 ± 0.219 | 4.076 ± 0.237 |
3.633 ± 0.405 | 9.556 ± 0.409 |
Met |
Asn |
Gln |
Pro |
Arg |
Ser |
Thr |
Val |
Trp |
Tyr |
|---|---|---|---|---|---|---|---|---|---|
2.167 ± 0.158 | 4.241 ± 0.436 |
6.491 ± 0.307 | 3.849 ± 0.261 |
7.079 ± 0.576 | 7.833 ± 0.422 |
6.13 ± 0.341 | 6.584 ± 0.222 |
1.352 ± 0.126 | 3.612 ± 0.341 |
Most of the basic statistics you can see at this page can be downloaded from this CSV file
Proteome-pI is available under Creative Commons Attribution-NoDerivs license, for more details see here
| Reference: Kozlowski LP. Proteome-pI 2.0: Proteome Isoelectric Point Database Update. Nucleic Acids Res. 2021, doi: 10.1093/nar/gkab944 | Contact: Lukasz P. Kozlowski |
