Ceraceosorus bombacis
Taxonomy: cellular organisms; Eukaryota; Opisthokonta; Fungi; Dikarya; Basidiomycota; Ustilaginomycotina; Exobasidiomycetes; Ceraceosorales; Ceraceosoraceae; Ceraceosorus
Average proteome isoelectric point is 7.02
Get precalculated fractions of proteins

Virtual 2D-PAGE plot for 8017 proteins (isoelectric point calculated using IPC2_protein)
Get csv file with sequences according to given criteria:
* You can choose from 21 different methods for calculating isoelectric point
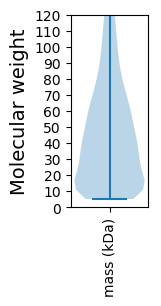
Summary statistics related to proteome-wise predictions


Protein with the lowest isoelectric point:
>tr|A0A0P1BRA5|A0A0P1BRA5_9BASI Uncharacterized protein OS=Ceraceosorus bombacis OX=401625 PE=4 SV=1
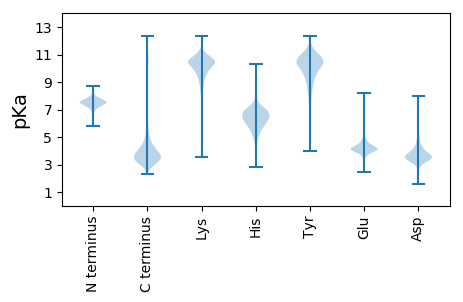
MM1 pKa = 8.18DD2 pKa = 4.64SFINKK7 pKa = 9.65AKK9 pKa = 10.75DD10 pKa = 3.3FAEE13 pKa = 4.16SDD15 pKa = 3.39QGKK18 pKa = 9.49GLINKK23 pKa = 9.51ALGNQGNQDD32 pKa = 3.42NQNSYY37 pKa = 10.64GGNNSSSNNDD47 pKa = 3.05SYY49 pKa = 12.18GSGNNSSSTGGFGSSNNDD67 pKa = 3.06NNDD70 pKa = 3.15SYY72 pKa = 12.2GSGNKK77 pKa = 9.5SSSGGGFGGSSDD89 pKa = 3.98NYY91 pKa = 9.62GSSGGRR97 pKa = 11.84DD98 pKa = 3.39NNDD101 pKa = 3.01SYY103 pKa = 11.79GSSGGRR109 pKa = 11.84DD110 pKa = 3.39NNDD113 pKa = 3.01SYY115 pKa = 11.79GSSGGRR121 pKa = 11.84DD122 pKa = 3.35NNNSYY127 pKa = 10.78GSSGGRR133 pKa = 11.84DD134 pKa = 3.39NNDD137 pKa = 3.01SYY139 pKa = 11.78GSSGGRR145 pKa = 11.84GNNDD149 pKa = 2.85SYY151 pKa = 11.81GSSGGNNDD159 pKa = 3.48SYY161 pKa = 11.52GSSGGRR167 pKa = 11.84DD168 pKa = 3.39NNDD171 pKa = 3.01SYY173 pKa = 11.79GSSGGRR179 pKa = 11.84DD180 pKa = 3.18NSDD183 pKa = 3.37SYY185 pKa = 11.63GSSGGRR191 pKa = 11.84GNNDD195 pKa = 2.69SFGGSGGNSGGFGSSGNDD213 pKa = 2.92NSSYY217 pKa = 10.88GGNSGTDD224 pKa = 3.29SYY226 pKa = 11.96GSGGRR231 pKa = 11.84QGGGNSDD238 pKa = 3.84SYY240 pKa = 12.03GSGGNDD246 pKa = 2.73NNYY249 pKa = 10.66
MM1 pKa = 8.18DD2 pKa = 4.64SFINKK7 pKa = 9.65AKK9 pKa = 10.75DD10 pKa = 3.3FAEE13 pKa = 4.16SDD15 pKa = 3.39QGKK18 pKa = 9.49GLINKK23 pKa = 9.51ALGNQGNQDD32 pKa = 3.42NQNSYY37 pKa = 10.64GGNNSSSNNDD47 pKa = 3.05SYY49 pKa = 12.18GSGNNSSSTGGFGSSNNDD67 pKa = 3.06NNDD70 pKa = 3.15SYY72 pKa = 12.2GSGNKK77 pKa = 9.5SSSGGGFGGSSDD89 pKa = 3.98NYY91 pKa = 9.62GSSGGRR97 pKa = 11.84DD98 pKa = 3.39NNDD101 pKa = 3.01SYY103 pKa = 11.79GSSGGRR109 pKa = 11.84DD110 pKa = 3.39NNDD113 pKa = 3.01SYY115 pKa = 11.79GSSGGRR121 pKa = 11.84DD122 pKa = 3.35NNNSYY127 pKa = 10.78GSSGGRR133 pKa = 11.84DD134 pKa = 3.39NNDD137 pKa = 3.01SYY139 pKa = 11.78GSSGGRR145 pKa = 11.84GNNDD149 pKa = 2.85SYY151 pKa = 11.81GSSGGNNDD159 pKa = 3.48SYY161 pKa = 11.52GSSGGRR167 pKa = 11.84DD168 pKa = 3.39NNDD171 pKa = 3.01SYY173 pKa = 11.79GSSGGRR179 pKa = 11.84DD180 pKa = 3.18NSDD183 pKa = 3.37SYY185 pKa = 11.63GSSGGRR191 pKa = 11.84GNNDD195 pKa = 2.69SFGGSGGNSGGFGSSGNDD213 pKa = 2.92NSSYY217 pKa = 10.88GGNSGTDD224 pKa = 3.29SYY226 pKa = 11.96GSGGRR231 pKa = 11.84QGGGNSDD238 pKa = 3.84SYY240 pKa = 12.03GSGGNDD246 pKa = 2.73NNYY249 pKa = 10.66
Molecular weight: 24.39 kDa
Isoelectric point according different methods:
Protein with the highest isoelectric point:
>tr|A0A0P1BJ97|A0A0P1BJ97_9BASI Uncharacterized protein OS=Ceraceosorus bombacis OX=401625 PE=4 SV=1
MM1 pKa = 7.72ASNARR6 pKa = 11.84GGRR9 pKa = 11.84GGGPGASQRR18 pKa = 11.84LSATPTGNWRR28 pKa = 11.84TGGPNGAASGASPAGGAGSRR48 pKa = 11.84WAAGPPRR55 pKa = 11.84NNQSAQNGNAXX66 pKa = 3.86
MM1 pKa = 7.72ASNARR6 pKa = 11.84GGRR9 pKa = 11.84GGGPGASQRR18 pKa = 11.84LSATPTGNWRR28 pKa = 11.84TGGPNGAASGASPAGGAGSRR48 pKa = 11.84WAAGPPRR55 pKa = 11.84NNQSAQNGNAXX66 pKa = 3.86
Molecular weight: 6.09 kDa
Isoelectric point according different methods:
Peptides (in silico digests for buttom-up proteomics)
Below you can find in silico digests of the whole proteome with Trypsin, Chymotrypsin, Trypsin+LysC, LysN, ArgC proteases suitable for different mass spec machines.| Try ESI |
 |
|---|
| ChTry ESI |
 |
|---|
| ArgC ESI |
 |
|---|
| LysN ESI |
 |
|---|
| TryLysC ESI |
 |
|---|
| Try MALDI |
 |
|---|
| ChTry MALDI |
 |
|---|
| ArgC MALDI |
 |
|---|
| LysN MALDI |
 |
|---|
| TryLysC MALDI |
 |
|---|
| Try LTQ |
 |
|---|
| ChTry LTQ |
 |
|---|
| ArgC LTQ |
 |
|---|
| LysN LTQ |
 |
|---|
| TryLysC LTQ |
 |
|---|
| Try MSlow |
 |
|---|
| ChTry MSlow |
 |
|---|
| ArgC MSlow |
 |
|---|
| LysN MSlow |
 |
|---|
| TryLysC MSlow |
 |
|---|
| Try MShigh |
 |
|---|
| ChTry MShigh |
 |
|---|
| ArgC MShigh |
 |
|---|
| LysN MShigh |
 |
|---|
| TryLysC MShigh |
 |
|---|
General Statistics
Number of major isoforms |
Number of additional isoforms |
Number of all proteins |
Number of amino acids |
Min. Seq. Length |
Max. Seq. Length |
Avg. Seq. Length |
Avg. Mol. Weight |
|---|---|---|---|---|---|---|---|
0 |
3982424 |
49 |
5271 |
496.7 |
53.87 |
Amino acid frequency
Ala |
Cys |
Asp |
Glu |
Phe |
Gly |
His |
Ile |
Lys |
Leu |
|---|---|---|---|---|---|---|---|---|---|
11.34 ± 0.03 | 1.018 ± 0.011 |
5.451 ± 0.016 | 5.87 ± 0.026 |
3.022 ± 0.016 | 7.319 ± 0.028 |
2.569 ± 0.015 | 3.778 ± 0.018 |
4.199 ± 0.025 | 8.952 ± 0.034 |
Met |
Asn |
Gln |
Pro |
Arg |
Ser |
Thr |
Val |
Trp |
Tyr |
|---|---|---|---|---|---|---|---|---|---|
1.835 ± 0.009 | 2.957 ± 0.012 |
6.12 ± 0.033 | 4.192 ± 0.016 |
6.97 ± 0.026 | 9.808 ± 0.046 |
5.582 ± 0.016 | 5.702 ± 0.018 |
1.261 ± 0.01 | 2.045 ± 0.013 |
Most of the basic statistics you can see at this page can be downloaded from this CSV file
Proteome-pI is available under Creative Commons Attribution-NoDerivs license, for more details see here
| Reference: Kozlowski LP. Proteome-pI 2.0: Proteome Isoelectric Point Database Update. Nucleic Acids Res. 2021, doi: 10.1093/nar/gkab944 | Contact: Lukasz P. Kozlowski |
