Arcticibacter tournemirensis
Taxonomy: cellular organisms; Bacteria;
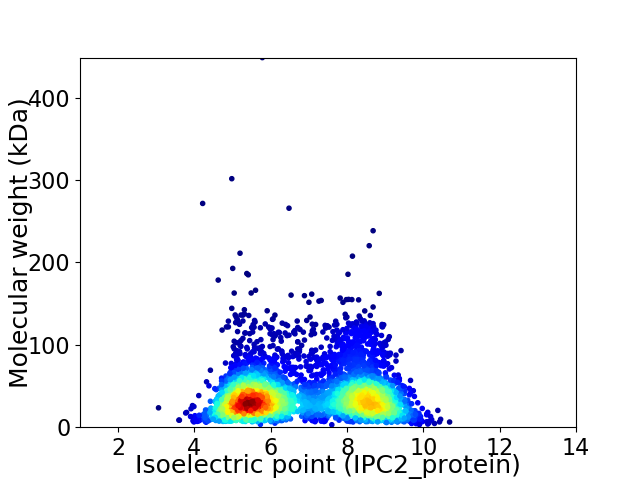
Average proteome isoelectric point is 6.85
Get precalculated fractions of proteins

Virtual 2D-PAGE plot for 4170 proteins (isoelectric point calculated using IPC2_protein)
Get csv file with sequences according to given criteria:
* You can choose from 21 different methods for calculating isoelectric point
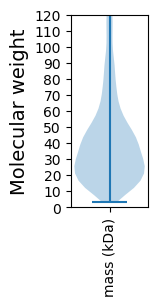
Summary statistics related to proteome-wise predictions


Protein with the lowest isoelectric point:
>tr|A0A4Q0ME70|A0A4Q0ME70_9SPHI Threonine/serine exporter OS=Arcticibacter tournemirensis OX=699437 GN=EKH83_03270 PE=4 SV=1
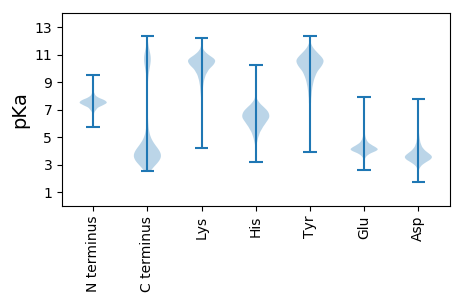
MM1 pKa = 7.72NDD3 pKa = 2.89NKK5 pKa = 10.28FNYY8 pKa = 9.02KK9 pKa = 10.47DD10 pKa = 3.31QVLNIACMLSTVYY23 pKa = 10.48RR24 pKa = 11.84EE25 pKa = 3.83LFIYY29 pKa = 9.93GLNAALHH36 pKa = 6.29NEE38 pKa = 4.1LKK40 pKa = 10.43DD41 pKa = 3.29IKK43 pKa = 10.92DD44 pKa = 3.13IFEE47 pKa = 5.26DD48 pKa = 4.24GEE50 pKa = 4.42EE51 pKa = 4.36YY52 pKa = 10.44PGDD55 pKa = 3.84VALLEE60 pKa = 4.52ALDD63 pKa = 4.69DD64 pKa = 4.26EE65 pKa = 4.88NIKK68 pKa = 10.57IILSAMYY75 pKa = 10.13DD76 pKa = 3.11IEE78 pKa = 4.68EE79 pKa = 4.58YY80 pKa = 11.07GDD82 pKa = 3.68SLLNINNISDD92 pKa = 3.65KK93 pKa = 10.62EE94 pKa = 4.13LNEE97 pKa = 3.93GLEE100 pKa = 4.19NGLGSEE106 pKa = 4.3YY107 pKa = 11.05APDD110 pKa = 3.37YY111 pKa = 11.49GEE113 pKa = 5.19AVEE116 pKa = 3.94NDD118 pKa = 2.95YY119 pKa = 11.25RR120 pKa = 11.84FWLNEE125 pKa = 3.58VMGYY129 pKa = 6.94THH131 pKa = 7.4LSVFNLLTLCYY142 pKa = 10.13SLSNGVNEE150 pKa = 4.23VPEE153 pKa = 4.09EE154 pKa = 4.26HH155 pKa = 7.05VSSLYY160 pKa = 10.77FPTDD164 pKa = 2.88EE165 pKa = 5.01SLALLDD171 pKa = 5.4IGDD174 pKa = 4.09QNVKK178 pKa = 10.51LLTEE182 pKa = 4.34LAFKK186 pKa = 11.0LSDD189 pKa = 3.96CANDD193 pKa = 3.58LCEE196 pKa = 4.56KK197 pKa = 10.68LL198 pKa = 3.88
MM1 pKa = 7.72NDD3 pKa = 2.89NKK5 pKa = 10.28FNYY8 pKa = 9.02KK9 pKa = 10.47DD10 pKa = 3.31QVLNIACMLSTVYY23 pKa = 10.48RR24 pKa = 11.84EE25 pKa = 3.83LFIYY29 pKa = 9.93GLNAALHH36 pKa = 6.29NEE38 pKa = 4.1LKK40 pKa = 10.43DD41 pKa = 3.29IKK43 pKa = 10.92DD44 pKa = 3.13IFEE47 pKa = 5.26DD48 pKa = 4.24GEE50 pKa = 4.42EE51 pKa = 4.36YY52 pKa = 10.44PGDD55 pKa = 3.84VALLEE60 pKa = 4.52ALDD63 pKa = 4.69DD64 pKa = 4.26EE65 pKa = 4.88NIKK68 pKa = 10.57IILSAMYY75 pKa = 10.13DD76 pKa = 3.11IEE78 pKa = 4.68EE79 pKa = 4.58YY80 pKa = 11.07GDD82 pKa = 3.68SLLNINNISDD92 pKa = 3.65KK93 pKa = 10.62EE94 pKa = 4.13LNEE97 pKa = 3.93GLEE100 pKa = 4.19NGLGSEE106 pKa = 4.3YY107 pKa = 11.05APDD110 pKa = 3.37YY111 pKa = 11.49GEE113 pKa = 5.19AVEE116 pKa = 3.94NDD118 pKa = 2.95YY119 pKa = 11.25RR120 pKa = 11.84FWLNEE125 pKa = 3.58VMGYY129 pKa = 6.94THH131 pKa = 7.4LSVFNLLTLCYY142 pKa = 10.13SLSNGVNEE150 pKa = 4.23VPEE153 pKa = 4.09EE154 pKa = 4.26HH155 pKa = 7.05VSSLYY160 pKa = 10.77FPTDD164 pKa = 2.88EE165 pKa = 5.01SLALLDD171 pKa = 5.4IGDD174 pKa = 4.09QNVKK178 pKa = 10.51LLTEE182 pKa = 4.34LAFKK186 pKa = 11.0LSDD189 pKa = 3.96CANDD193 pKa = 3.58LCEE196 pKa = 4.56KK197 pKa = 10.68LL198 pKa = 3.88
Molecular weight: 22.44 kDa
Isoelectric point according different methods:
Protein with the highest isoelectric point:
>tr|A0A4Q0M5L6|A0A4Q0M5L6_9SPHI Rod shape-determining protein RodA OS=Arcticibacter tournemirensis OX=699437 GN=rodA PE=4 SV=1
MM1 pKa = 8.15RR2 pKa = 11.84YY3 pKa = 8.82FLCIILPPVAVLTTGRR19 pKa = 11.84IGALILNIVLCLFFWIPGVIHH40 pKa = 7.41AILVTNDD47 pKa = 2.94YY48 pKa = 11.01YY49 pKa = 11.5ADD51 pKa = 3.36KK52 pKa = 10.76RR53 pKa = 11.84NRR55 pKa = 11.84KK56 pKa = 9.32LIRR59 pKa = 11.84AVKK62 pKa = 10.19NSRR65 pKa = 3.18
MM1 pKa = 8.15RR2 pKa = 11.84YY3 pKa = 8.82FLCIILPPVAVLTTGRR19 pKa = 11.84IGALILNIVLCLFFWIPGVIHH40 pKa = 7.41AILVTNDD47 pKa = 2.94YY48 pKa = 11.01YY49 pKa = 11.5ADD51 pKa = 3.36KK52 pKa = 10.76RR53 pKa = 11.84NRR55 pKa = 11.84KK56 pKa = 9.32LIRR59 pKa = 11.84AVKK62 pKa = 10.19NSRR65 pKa = 3.18
Molecular weight: 7.46 kDa
Isoelectric point according different methods:
Peptides (in silico digests for buttom-up proteomics)
Below you can find in silico digests of the whole proteome with Trypsin, Chymotrypsin, Trypsin+LysC, LysN, ArgC proteases suitable for different mass spec machines.| Try ESI |
 |
|---|
| ChTry ESI |
 |
|---|
| ArgC ESI |
 |
|---|
| LysN ESI |
 |
|---|
| TryLysC ESI |
 |
|---|
| Try MALDI |
 |
|---|
| ChTry MALDI |
 |
|---|
| ArgC MALDI |
 |
|---|
| LysN MALDI |
 |
|---|
| TryLysC MALDI |
 |
|---|
| Try LTQ |
 |
|---|
| ChTry LTQ |
 |
|---|
| ArgC LTQ |
 |
|---|
| LysN LTQ |
 |
|---|
| TryLysC LTQ |
 |
|---|
| Try MSlow |
 |
|---|
| ChTry MSlow |
 |
|---|
| ArgC MSlow |
 |
|---|
| LysN MSlow |
 |
|---|
| TryLysC MSlow |
 |
|---|
| Try MShigh |
 |
|---|
| ChTry MShigh |
 |
|---|
| ArgC MShigh |
 |
|---|
| LysN MShigh |
 |
|---|
| TryLysC MShigh |
 |
|---|
General Statistics
Number of major isoforms |
Number of additional isoforms |
Number of all proteins |
Number of amino acids |
Min. Seq. Length |
Max. Seq. Length |
Avg. Seq. Length |
Avg. Mol. Weight |
|---|---|---|---|---|---|---|---|
0 |
1573326 |
25 |
4255 |
377.3 |
42.35 |
Amino acid frequency
Ala |
Cys |
Asp |
Glu |
Phe |
Gly |
His |
Ile |
Lys |
Leu |
|---|---|---|---|---|---|---|---|---|---|
7.185 ± 0.033 | 0.79 ± 0.013 |
5.328 ± 0.025 | 5.926 ± 0.037 |
4.909 ± 0.023 | 7.063 ± 0.034 |
1.728 ± 0.017 | 7.015 ± 0.033 |
6.694 ± 0.035 | 9.358 ± 0.038 |
Met |
Asn |
Gln |
Pro |
Arg |
Ser |
Thr |
Val |
Trp |
Tyr |
|---|---|---|---|---|---|---|---|---|---|
2.188 ± 0.015 | 5.472 ± 0.034 |
3.877 ± 0.021 | 3.424 ± 0.017 |
4.575 ± 0.026 | 6.969 ± 0.035 |
5.54 ± 0.034 | 6.435 ± 0.022 |
1.283 ± 0.014 | 4.239 ± 0.027 |
Most of the basic statistics you can see at this page can be downloaded from this CSV file
Proteome-pI is available under Creative Commons Attribution-NoDerivs license, for more details see here
| Reference: Kozlowski LP. Proteome-pI 2.0: Proteome Isoelectric Point Database Update. Nucleic Acids Res. 2021, doi: 10.1093/nar/gkab944 | Contact: Lukasz P. Kozlowski |
