Streptomyces adustus
Taxonomy: cellular organisms; Bacteria; Terrabacteria group; Actinobacteria; Actinomycetia; Streptomycetales; Streptomycetaceae; Streptomyces
Average proteome isoelectric point is 6.42
Get precalculated fractions of proteins

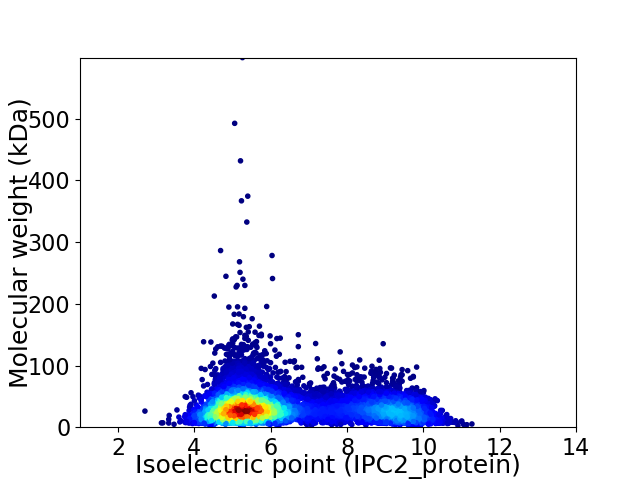
Virtual 2D-PAGE plot for 8617 proteins (isoelectric point calculated using IPC2_protein)
Get csv file with sequences according to given criteria:
* You can choose from 21 different methods for calculating isoelectric point
Summary statistics related to proteome-wise predictions


Protein with the lowest isoelectric point:
>tr|A0A5N8VB21|A0A5N8VB21_9ACTN Uncharacterized protein OS=Streptomyces adustus OX=1609272 GN=FNH09_12660 PE=4 SV=1
MM1 pKa = 7.51GLGGTPAAAAVACPSGVEE19 pKa = 4.06SDD21 pKa = 4.1FNGDD25 pKa = 4.28GIRR28 pKa = 11.84DD29 pKa = 3.57TAIADD34 pKa = 3.61PEE36 pKa = 4.22ATVDD40 pKa = 3.74GMAKK44 pKa = 10.07AGLVHH49 pKa = 6.17VVYY52 pKa = 10.68GGGKK56 pKa = 8.02GTLALSQATDD66 pKa = 5.16GIPGAPEE73 pKa = 3.69TGDD76 pKa = 3.12QYY78 pKa = 11.82GYY80 pKa = 11.22SLAVYY85 pKa = 10.16DD86 pKa = 5.51ADD88 pKa = 6.07LDD90 pKa = 4.13GCSDD94 pKa = 4.1LVVGSPYY101 pKa = 10.84EE102 pKa = 4.61DD103 pKa = 3.64IGTVPDD109 pKa = 3.6SGLVQVIYY117 pKa = 10.11GAPAGLGSGTKK128 pKa = 10.23AVTEE132 pKa = 4.19FLQGSDD138 pKa = 3.75KK139 pKa = 11.01PLGGTPEE146 pKa = 3.79TDD148 pKa = 2.69DD149 pKa = 3.27WVGYY153 pKa = 10.07AVAAGKK159 pKa = 8.55TSAGTPYY166 pKa = 11.06LLIGGPGEE174 pKa = 4.41SIGTVEE180 pKa = 4.86DD181 pKa = 3.96AGDD184 pKa = 4.11FYY186 pKa = 11.51YY187 pKa = 11.26VSGTALTVVGITQNTEE203 pKa = 3.35TGGAVPGVAEE213 pKa = 3.76QDD215 pKa = 3.46DD216 pKa = 4.42RR217 pKa = 11.84FGSTLAATPTHH228 pKa = 6.4FAVGTPGEE236 pKa = 4.23ALGTTTFAGGVAYY249 pKa = 10.12FSHH252 pKa = 7.04TLTSGYY258 pKa = 8.81PKK260 pKa = 10.33PLGGLGQDD268 pKa = 3.16QDD270 pKa = 4.42AISGAEE276 pKa = 3.85EE277 pKa = 3.87VGDD280 pKa = 3.76QFGAALAMVPYY291 pKa = 9.48RR292 pKa = 11.84AAGATSTTEE301 pKa = 3.61SLLAVGVPGEE311 pKa = 4.34DD312 pKa = 4.04LSTTVDD318 pKa = 3.14AGAVQVFRR326 pKa = 11.84LAANGTFTEE335 pKa = 4.77TAWIDD340 pKa = 3.51QNTADD345 pKa = 3.77VDD347 pKa = 4.0QEE349 pKa = 4.29AEE351 pKa = 3.86AGDD354 pKa = 3.79FFGRR358 pKa = 11.84RR359 pKa = 11.84LAAVNTSPNATSTGTNTRR377 pKa = 11.84LAIGVPGEE385 pKa = 4.37EE386 pKa = 4.09SSEE389 pKa = 4.11DD390 pKa = 3.48NPEE393 pKa = 3.83QGGVQIVPLVGAPGASDD410 pKa = 2.9QWLEE414 pKa = 4.19PGSGIPSGPAPRR426 pKa = 11.84MLTGLSLAATPSLLYY441 pKa = 10.68VGTPYY446 pKa = 11.0GPAAGQAVYY455 pKa = 10.4GFPWGVASGGAPTQTFKK472 pKa = 10.83PGEE475 pKa = 4.22GGIPATGVAFGTTVRR490 pKa = 4.25
MM1 pKa = 7.51GLGGTPAAAAVACPSGVEE19 pKa = 4.06SDD21 pKa = 4.1FNGDD25 pKa = 4.28GIRR28 pKa = 11.84DD29 pKa = 3.57TAIADD34 pKa = 3.61PEE36 pKa = 4.22ATVDD40 pKa = 3.74GMAKK44 pKa = 10.07AGLVHH49 pKa = 6.17VVYY52 pKa = 10.68GGGKK56 pKa = 8.02GTLALSQATDD66 pKa = 5.16GIPGAPEE73 pKa = 3.69TGDD76 pKa = 3.12QYY78 pKa = 11.82GYY80 pKa = 11.22SLAVYY85 pKa = 10.16DD86 pKa = 5.51ADD88 pKa = 6.07LDD90 pKa = 4.13GCSDD94 pKa = 4.1LVVGSPYY101 pKa = 10.84EE102 pKa = 4.61DD103 pKa = 3.64IGTVPDD109 pKa = 3.6SGLVQVIYY117 pKa = 10.11GAPAGLGSGTKK128 pKa = 10.23AVTEE132 pKa = 4.19FLQGSDD138 pKa = 3.75KK139 pKa = 11.01PLGGTPEE146 pKa = 3.79TDD148 pKa = 2.69DD149 pKa = 3.27WVGYY153 pKa = 10.07AVAAGKK159 pKa = 8.55TSAGTPYY166 pKa = 11.06LLIGGPGEE174 pKa = 4.41SIGTVEE180 pKa = 4.86DD181 pKa = 3.96AGDD184 pKa = 4.11FYY186 pKa = 11.51YY187 pKa = 11.26VSGTALTVVGITQNTEE203 pKa = 3.35TGGAVPGVAEE213 pKa = 3.76QDD215 pKa = 3.46DD216 pKa = 4.42RR217 pKa = 11.84FGSTLAATPTHH228 pKa = 6.4FAVGTPGEE236 pKa = 4.23ALGTTTFAGGVAYY249 pKa = 10.12FSHH252 pKa = 7.04TLTSGYY258 pKa = 8.81PKK260 pKa = 10.33PLGGLGQDD268 pKa = 3.16QDD270 pKa = 4.42AISGAEE276 pKa = 3.85EE277 pKa = 3.87VGDD280 pKa = 3.76QFGAALAMVPYY291 pKa = 9.48RR292 pKa = 11.84AAGATSTTEE301 pKa = 3.61SLLAVGVPGEE311 pKa = 4.34DD312 pKa = 4.04LSTTVDD318 pKa = 3.14AGAVQVFRR326 pKa = 11.84LAANGTFTEE335 pKa = 4.77TAWIDD340 pKa = 3.51QNTADD345 pKa = 3.77VDD347 pKa = 4.0QEE349 pKa = 4.29AEE351 pKa = 3.86AGDD354 pKa = 3.79FFGRR358 pKa = 11.84RR359 pKa = 11.84LAAVNTSPNATSTGTNTRR377 pKa = 11.84LAIGVPGEE385 pKa = 4.37EE386 pKa = 4.09SSEE389 pKa = 4.11DD390 pKa = 3.48NPEE393 pKa = 3.83QGGVQIVPLVGAPGASDD410 pKa = 2.9QWLEE414 pKa = 4.19PGSGIPSGPAPRR426 pKa = 11.84MLTGLSLAATPSLLYY441 pKa = 10.68VGTPYY446 pKa = 11.0GPAAGQAVYY455 pKa = 10.4GFPWGVASGGAPTQTFKK472 pKa = 10.83PGEE475 pKa = 4.22GGIPATGVAFGTTVRR490 pKa = 4.25
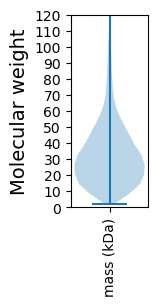
Molecular weight: 48.5 kDa
Isoelectric point according different methods:
Protein with the highest isoelectric point:
>tr|A0A5N8VFJ1|A0A5N8VFJ1_9ACTN RNA-binding transcriptional accessory protein OS=Streptomyces adustus OX=1609272 GN=FNH09_19800 PE=4 SV=1
MM1 pKa = 7.69SKK3 pKa = 9.0RR4 pKa = 11.84TFQPNNRR11 pKa = 11.84RR12 pKa = 11.84RR13 pKa = 11.84AKK15 pKa = 8.7THH17 pKa = 5.15GFRR20 pKa = 11.84LRR22 pKa = 11.84MRR24 pKa = 11.84TRR26 pKa = 11.84AGRR29 pKa = 11.84AILANRR35 pKa = 11.84RR36 pKa = 11.84SKK38 pKa = 10.89GRR40 pKa = 11.84ASLSAA45 pKa = 3.83
MM1 pKa = 7.69SKK3 pKa = 9.0RR4 pKa = 11.84TFQPNNRR11 pKa = 11.84RR12 pKa = 11.84RR13 pKa = 11.84AKK15 pKa = 8.7THH17 pKa = 5.15GFRR20 pKa = 11.84LRR22 pKa = 11.84MRR24 pKa = 11.84TRR26 pKa = 11.84AGRR29 pKa = 11.84AILANRR35 pKa = 11.84RR36 pKa = 11.84SKK38 pKa = 10.89GRR40 pKa = 11.84ASLSAA45 pKa = 3.83
Molecular weight: 5.24 kDa
Isoelectric point according different methods:
Peptides (in silico digests for buttom-up proteomics)
Below you can find in silico digests of the whole proteome with Trypsin, Chymotrypsin, Trypsin+LysC, LysN, ArgC proteases suitable for different mass spec machines.| Try ESI |
 |
|---|
| ChTry ESI |
 |
|---|
| ArgC ESI |
 |
|---|
| LysN ESI |
 |
|---|
| TryLysC ESI |
 |
|---|
| Try MALDI |
 |
|---|
| ChTry MALDI |
 |
|---|
| ArgC MALDI |
 |
|---|
| LysN MALDI |
 |
|---|
| TryLysC MALDI |
 |
|---|
| Try LTQ |
 |
|---|
| ChTry LTQ |
 |
|---|
| ArgC LTQ |
 |
|---|
| LysN LTQ |
 |
|---|
| TryLysC LTQ |
 |
|---|
| Try MSlow |
 |
|---|
| ChTry MSlow |
 |
|---|
| ArgC MSlow |
 |
|---|
| LysN MSlow |
 |
|---|
| TryLysC MSlow |
 |
|---|
| Try MShigh |
 |
|---|
| ChTry MShigh |
 |
|---|
| ArgC MShigh |
 |
|---|
| LysN MShigh |
 |
|---|
| TryLysC MShigh |
 |
|---|
General Statistics
Number of major isoforms |
Number of additional isoforms |
Number of all proteins |
Number of amino acids |
Min. Seq. Length |
Max. Seq. Length |
Avg. Seq. Length |
Avg. Mol. Weight |
|---|---|---|---|---|---|---|---|
0 |
2795366 |
18 |
5576 |
324.4 |
34.73 |
Amino acid frequency
Ala |
Cys |
Asp |
Glu |
Phe |
Gly |
His |
Ile |
Lys |
Leu |
|---|---|---|---|---|---|---|---|---|---|
13.595 ± 0.041 | 0.8 ± 0.007 |
6.057 ± 0.02 | 5.472 ± 0.031 |
2.722 ± 0.017 | 9.427 ± 0.028 |
2.345 ± 0.014 | 3.084 ± 0.019 |
2.084 ± 0.021 | 10.305 ± 0.036 |
Met |
Asn |
Gln |
Pro |
Arg |
Ser |
Thr |
Val |
Trp |
Tyr |
|---|---|---|---|---|---|---|---|---|---|
1.69 ± 0.011 | 1.799 ± 0.015 |
6.002 ± 0.023 | 2.844 ± 0.015 |
8.058 ± 0.036 | 5.173 ± 0.025 |
6.331 ± 0.03 | 8.523 ± 0.024 |
1.547 ± 0.011 | 2.141 ± 0.014 |
Most of the basic statistics you can see at this page can be downloaded from this CSV file
Proteome-pI is available under Creative Commons Attribution-NoDerivs license, for more details see here
| Reference: Kozlowski LP. Proteome-pI 2.0: Proteome Isoelectric Point Database Update. Nucleic Acids Res. 2021, doi: 10.1093/nar/gkab944 | Contact: Lukasz P. Kozlowski |
