Pedobacter hartonius
Taxonomy: cellular organisms; Bacteria; FCB group; Bacteroidetes/Chlorobi group; Bacteroidetes; Sphingobacteriia; Sphingobacteriales; Sphingobacteriaceae; Pedobacter
Average proteome isoelectric point is 6.81
Get precalculated fractions of proteins

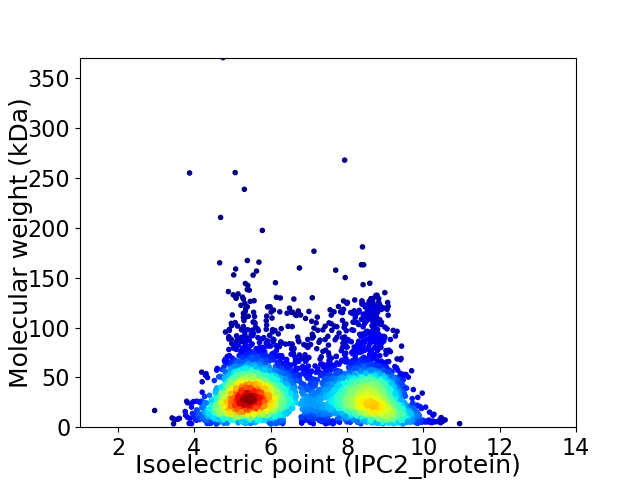
Virtual 2D-PAGE plot for 4634 proteins (isoelectric point calculated using IPC2_protein)
Get csv file with sequences according to given criteria:
* You can choose from 21 different methods for calculating isoelectric point
Summary statistics related to proteome-wise predictions


Protein with the lowest isoelectric point:
>tr|A0A1H3WDI3|A0A1H3WDI3_9SPHI 6-phosphogluconate dehydrogenase decarboxylating OS=Pedobacter hartonius OX=425514 GN=SAMN05443550_101206 PE=3 SV=1
MM1 pKa = 7.88KK2 pKa = 9.33ITTYY6 pKa = 7.47EE7 pKa = 3.87QRR9 pKa = 11.84DD10 pKa = 4.55LIPLTISVLGTISFFNACNTLKK32 pKa = 10.9YY33 pKa = 10.38LVEE36 pKa = 4.32TEE38 pKa = 3.99FCDD41 pKa = 4.35LKK43 pKa = 11.46GLISTDD49 pKa = 3.44TLDD52 pKa = 4.28DD53 pKa = 3.87SSIALLDD60 pKa = 3.68VVDD63 pKa = 4.61NDD65 pKa = 3.61FHH67 pKa = 7.9KK68 pKa = 10.06ITYY71 pKa = 10.56DD72 pKa = 3.19SMTGIYY78 pKa = 7.52EE79 pKa = 4.41TAHH82 pKa = 6.15SLANIYY88 pKa = 10.68GLDD91 pKa = 3.09IGTIIRR97 pKa = 11.84DD98 pKa = 3.43EE99 pKa = 4.4RR100 pKa = 11.84LTEE103 pKa = 3.85MGEE106 pKa = 4.14DD107 pKa = 3.74FVLEE111 pKa = 4.64LIVDD115 pKa = 3.81QFPEE119 pKa = 4.45DD120 pKa = 3.62NFVDD124 pKa = 3.9EE125 pKa = 5.12DD126 pKa = 4.07FEE128 pKa = 4.45PAEE131 pKa = 4.29SLDD134 pKa = 3.78LFAFSLVNVVNFLCSMLLAGKK155 pKa = 10.21VDD157 pKa = 5.91FDD159 pKa = 5.6LSWTSSKK166 pKa = 10.67FYY168 pKa = 11.03LDD170 pKa = 4.76FLSEE174 pKa = 4.42DD175 pKa = 3.86YY176 pKa = 10.81SGKK179 pKa = 9.55EE180 pKa = 3.54HH181 pKa = 6.73ATALQLLQEE190 pKa = 4.65LGSVLSLSHH199 pKa = 6.69GRR201 pKa = 11.84ILDD204 pKa = 3.77LLYY207 pKa = 11.29NNGDD211 pKa = 3.65ICWDD215 pKa = 3.7DD216 pKa = 3.45PP217 pKa = 4.23
MM1 pKa = 7.88KK2 pKa = 9.33ITTYY6 pKa = 7.47EE7 pKa = 3.87QRR9 pKa = 11.84DD10 pKa = 4.55LIPLTISVLGTISFFNACNTLKK32 pKa = 10.9YY33 pKa = 10.38LVEE36 pKa = 4.32TEE38 pKa = 3.99FCDD41 pKa = 4.35LKK43 pKa = 11.46GLISTDD49 pKa = 3.44TLDD52 pKa = 4.28DD53 pKa = 3.87SSIALLDD60 pKa = 3.68VVDD63 pKa = 4.61NDD65 pKa = 3.61FHH67 pKa = 7.9KK68 pKa = 10.06ITYY71 pKa = 10.56DD72 pKa = 3.19SMTGIYY78 pKa = 7.52EE79 pKa = 4.41TAHH82 pKa = 6.15SLANIYY88 pKa = 10.68GLDD91 pKa = 3.09IGTIIRR97 pKa = 11.84DD98 pKa = 3.43EE99 pKa = 4.4RR100 pKa = 11.84LTEE103 pKa = 3.85MGEE106 pKa = 4.14DD107 pKa = 3.74FVLEE111 pKa = 4.64LIVDD115 pKa = 3.81QFPEE119 pKa = 4.45DD120 pKa = 3.62NFVDD124 pKa = 3.9EE125 pKa = 5.12DD126 pKa = 4.07FEE128 pKa = 4.45PAEE131 pKa = 4.29SLDD134 pKa = 3.78LFAFSLVNVVNFLCSMLLAGKK155 pKa = 10.21VDD157 pKa = 5.91FDD159 pKa = 5.6LSWTSSKK166 pKa = 10.67FYY168 pKa = 11.03LDD170 pKa = 4.76FLSEE174 pKa = 4.42DD175 pKa = 3.86YY176 pKa = 10.81SGKK179 pKa = 9.55EE180 pKa = 3.54HH181 pKa = 6.73ATALQLLQEE190 pKa = 4.65LGSVLSLSHH199 pKa = 6.69GRR201 pKa = 11.84ILDD204 pKa = 3.77LLYY207 pKa = 11.29NNGDD211 pKa = 3.65ICWDD215 pKa = 3.7DD216 pKa = 3.45PP217 pKa = 4.23
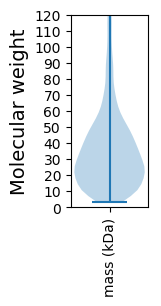
Molecular weight: 24.48 kDa
Isoelectric point according different methods:
Protein with the highest isoelectric point:
>tr|A0A1H3ZSW0|A0A1H3ZSW0_9SPHI Thiamine-phosphate pyrophosphorylase OS=Pedobacter hartonius OX=425514 GN=SAMN05443550_102480 PE=4 SV=1
MM1 pKa = 7.84PSGKK5 pKa = 9.41KK6 pKa = 9.7RR7 pKa = 11.84KK8 pKa = 6.09SHH10 pKa = 6.26KK11 pKa = 9.67MATHH15 pKa = 5.94KK16 pKa = 10.35RR17 pKa = 11.84KK18 pKa = 9.84KK19 pKa = 9.28RR20 pKa = 11.84LRR22 pKa = 11.84KK23 pKa = 9.26NRR25 pKa = 11.84HH26 pKa = 4.71KK27 pKa = 10.87KK28 pKa = 9.36KK29 pKa = 10.77
MM1 pKa = 7.84PSGKK5 pKa = 9.41KK6 pKa = 9.7RR7 pKa = 11.84KK8 pKa = 6.09SHH10 pKa = 6.26KK11 pKa = 9.67MATHH15 pKa = 5.94KK16 pKa = 10.35RR17 pKa = 11.84KK18 pKa = 9.84KK19 pKa = 9.28RR20 pKa = 11.84LRR22 pKa = 11.84KK23 pKa = 9.26NRR25 pKa = 11.84HH26 pKa = 4.71KK27 pKa = 10.87KK28 pKa = 9.36KK29 pKa = 10.77
Molecular weight: 3.61 kDa
Isoelectric point according different methods:
Peptides (in silico digests for buttom-up proteomics)
Below you can find in silico digests of the whole proteome with Trypsin, Chymotrypsin, Trypsin+LysC, LysN, ArgC proteases suitable for different mass spec machines.| Try ESI |
 |
|---|
| ChTry ESI |
 |
|---|
| ArgC ESI |
 |
|---|
| LysN ESI |
 |
|---|
| TryLysC ESI |
 |
|---|
| Try MALDI |
 |
|---|
| ChTry MALDI |
 |
|---|
| ArgC MALDI |
 |
|---|
| LysN MALDI |
 |
|---|
| TryLysC MALDI |
 |
|---|
| Try LTQ |
 |
|---|
| ChTry LTQ |
 |
|---|
| ArgC LTQ |
 |
|---|
| LysN LTQ |
 |
|---|
| TryLysC LTQ |
 |
|---|
| Try MSlow |
 |
|---|
| ChTry MSlow |
 |
|---|
| ArgC MSlow |
 |
|---|
| LysN MSlow |
 |
|---|
| TryLysC MSlow |
 |
|---|
| Try MShigh |
 |
|---|
| ChTry MShigh |
 |
|---|
| ArgC MShigh |
 |
|---|
| LysN MShigh |
 |
|---|
| TryLysC MShigh |
 |
|---|
General Statistics
Number of major isoforms |
Number of additional isoforms |
Number of all proteins |
Number of amino acids |
Min. Seq. Length |
Max. Seq. Length |
Avg. Seq. Length |
Avg. Mol. Weight |
|---|---|---|---|---|---|---|---|
0 |
1541803 |
29 |
3662 |
332.7 |
37.25 |
Amino acid frequency
Ala |
Cys |
Asp |
Glu |
Phe |
Gly |
His |
Ile |
Lys |
Leu |
|---|---|---|---|---|---|---|---|---|---|
7.581 ± 0.035 | 0.777 ± 0.01 |
5.331 ± 0.027 | 5.742 ± 0.042 |
4.9 ± 0.026 | 6.867 ± 0.036 |
1.877 ± 0.018 | 7.319 ± 0.034 |
6.831 ± 0.041 | 9.728 ± 0.038 |
Met |
Asn |
Gln |
Pro |
Arg |
Ser |
Thr |
Val |
Trp |
Tyr |
|---|---|---|---|---|---|---|---|---|---|
2.34 ± 0.017 | 5.433 ± 0.034 |
3.803 ± 0.021 | 3.648 ± 0.023 |
4.062 ± 0.022 | 6.557 ± 0.034 |
5.772 ± 0.04 | 6.267 ± 0.026 |
1.108 ± 0.015 | 4.056 ± 0.025 |
Most of the basic statistics you can see at this page can be downloaded from this CSV file
Proteome-pI is available under Creative Commons Attribution-NoDerivs license, for more details see here
| Reference: Kozlowski LP. Proteome-pI 2.0: Proteome Isoelectric Point Database Update. Nucleic Acids Res. 2021, doi: 10.1093/nar/gkab944 | Contact: Lukasz P. Kozlowski |
