Xanthomonadaceae bacterium NML03-0222
Taxonomy: cellular organisms; Bacteria; Proteobacteria; Gammaproteobacteria; Xanthomonadales; Xanthomonadaceae; unclassified Xanthomonadaceae
Average proteome isoelectric point is 6.71
Get precalculated fractions of proteins

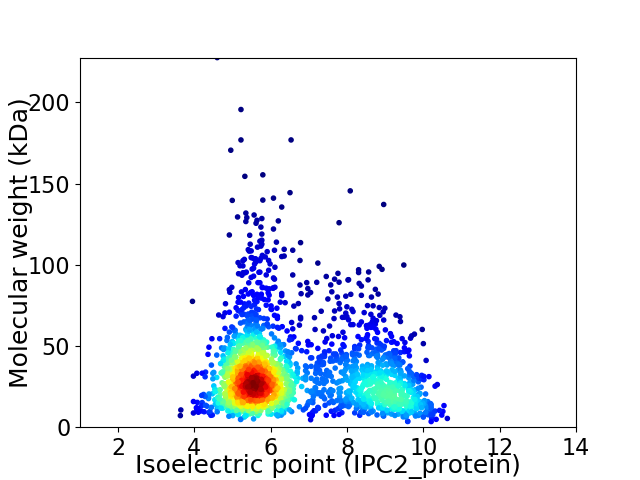
Virtual 2D-PAGE plot for 2067 proteins (isoelectric point calculated using IPC2_protein)
Get csv file with sequences according to given criteria:
* You can choose from 21 different methods for calculating isoelectric point
Summary statistics related to proteome-wise predictions


Protein with the lowest isoelectric point:
>tr|A0A2M9E6V1|A0A2M9E6V1_9GAMM Endonuclease V OS=Xanthomonadaceae bacterium NML03-0222 OX=2032581 GN=nfi PE=3 SV=1
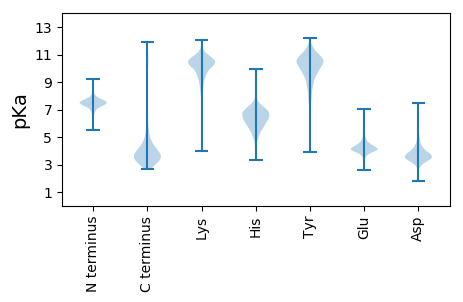
MM1 pKa = 7.47SEE3 pKa = 4.39SPASPVPFRR12 pKa = 11.84TWMCVVCGFIYY23 pKa = 10.67DD24 pKa = 3.92EE25 pKa = 4.44AQGLPEE31 pKa = 4.41EE32 pKa = 5.46GIAPGTRR39 pKa = 11.84WQDD42 pKa = 3.1IPDD45 pKa = 4.16DD46 pKa = 4.1WTCPDD51 pKa = 4.22CGVGKK56 pKa = 10.22DD57 pKa = 3.86DD58 pKa = 6.11FDD60 pKa = 3.77MQEE63 pKa = 3.62VV64 pKa = 3.44
MM1 pKa = 7.47SEE3 pKa = 4.39SPASPVPFRR12 pKa = 11.84TWMCVVCGFIYY23 pKa = 10.67DD24 pKa = 3.92EE25 pKa = 4.44AQGLPEE31 pKa = 4.41EE32 pKa = 5.46GIAPGTRR39 pKa = 11.84WQDD42 pKa = 3.1IPDD45 pKa = 4.16DD46 pKa = 4.1WTCPDD51 pKa = 4.22CGVGKK56 pKa = 10.22DD57 pKa = 3.86DD58 pKa = 6.11FDD60 pKa = 3.77MQEE63 pKa = 3.62VV64 pKa = 3.44
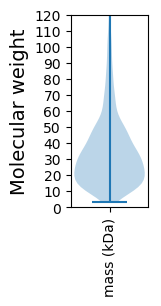
Molecular weight: 7.13 kDa
Isoelectric point according different methods:
Protein with the highest isoelectric point:
>tr|A0A2M9E0K7|A0A2M9E0K7_9GAMM Amidohydrolase OS=Xanthomonadaceae bacterium NML03-0222 OX=2032581 GN=CO611_07845 PE=4 SV=1
MM1 pKa = 7.28MVTIQQGLRR10 pKa = 11.84EE11 pKa = 4.58DD12 pKa = 3.78GFEE15 pKa = 3.86VSMVKK20 pKa = 10.25LCRR23 pKa = 11.84WFGVARR29 pKa = 11.84RR30 pKa = 11.84SVYY33 pKa = 10.21YY34 pKa = 10.18RR35 pKa = 11.84PTKK38 pKa = 10.24AAPKK42 pKa = 9.97VNPALAKK49 pKa = 9.8PIKK52 pKa = 10.17ALIEE56 pKa = 4.12AEE58 pKa = 4.03PSFGYY63 pKa = 8.7RR64 pKa = 11.84TVAGLLGMNKK74 pKa = 8.28NTVQRR79 pKa = 11.84IFQLKK84 pKa = 7.71GWQVRR89 pKa = 11.84KK90 pKa = 9.35RR91 pKa = 11.84AVGRR95 pKa = 11.84RR96 pKa = 11.84PRR98 pKa = 11.84IQALPSVATAPDD110 pKa = 3.97PRR112 pKa = 11.84WATDD116 pKa = 3.31LCRR119 pKa = 11.84VWGGRR124 pKa = 11.84DD125 pKa = 3.05GWLTLALVIDD135 pKa = 4.07CHH137 pKa = 6.05TRR139 pKa = 11.84QLLGWHH145 pKa = 7.13LSRR148 pKa = 11.84SGKK151 pKa = 10.58ASTAVAALEE160 pKa = 3.81QALIARR166 pKa = 11.84YY167 pKa = 7.27GTLGRR172 pKa = 11.84VPEE175 pKa = 4.23PFLLRR180 pKa = 11.84SDD182 pKa = 3.61NGLVFTSRR190 pKa = 11.84DD191 pKa = 3.27YY192 pKa = 10.56TRR194 pKa = 11.84LVRR197 pKa = 11.84SYY199 pKa = 11.26GLQQEE204 pKa = 5.57FITPHH209 pKa = 6.55CPQQNGMVEE218 pKa = 3.95RR219 pKa = 11.84LIRR222 pKa = 11.84TLKK225 pKa = 7.64EE226 pKa = 3.87QCVHH230 pKa = 5.07RR231 pKa = 11.84HH232 pKa = 4.88RR233 pKa = 11.84FEE235 pKa = 4.29SQQHH239 pKa = 4.7AMRR242 pKa = 11.84VLGDD246 pKa = 3.82WIQFYY251 pKa = 8.02NHH253 pKa = 6.68RR254 pKa = 11.84RR255 pKa = 11.84PHH257 pKa = 5.38QALGMKK263 pKa = 9.24TPAEE267 pKa = 4.41AYY269 pKa = 10.25ALAAA273 pKa = 4.47
MM1 pKa = 7.28MVTIQQGLRR10 pKa = 11.84EE11 pKa = 4.58DD12 pKa = 3.78GFEE15 pKa = 3.86VSMVKK20 pKa = 10.25LCRR23 pKa = 11.84WFGVARR29 pKa = 11.84RR30 pKa = 11.84SVYY33 pKa = 10.21YY34 pKa = 10.18RR35 pKa = 11.84PTKK38 pKa = 10.24AAPKK42 pKa = 9.97VNPALAKK49 pKa = 9.8PIKK52 pKa = 10.17ALIEE56 pKa = 4.12AEE58 pKa = 4.03PSFGYY63 pKa = 8.7RR64 pKa = 11.84TVAGLLGMNKK74 pKa = 8.28NTVQRR79 pKa = 11.84IFQLKK84 pKa = 7.71GWQVRR89 pKa = 11.84KK90 pKa = 9.35RR91 pKa = 11.84AVGRR95 pKa = 11.84RR96 pKa = 11.84PRR98 pKa = 11.84IQALPSVATAPDD110 pKa = 3.97PRR112 pKa = 11.84WATDD116 pKa = 3.31LCRR119 pKa = 11.84VWGGRR124 pKa = 11.84DD125 pKa = 3.05GWLTLALVIDD135 pKa = 4.07CHH137 pKa = 6.05TRR139 pKa = 11.84QLLGWHH145 pKa = 7.13LSRR148 pKa = 11.84SGKK151 pKa = 10.58ASTAVAALEE160 pKa = 3.81QALIARR166 pKa = 11.84YY167 pKa = 7.27GTLGRR172 pKa = 11.84VPEE175 pKa = 4.23PFLLRR180 pKa = 11.84SDD182 pKa = 3.61NGLVFTSRR190 pKa = 11.84DD191 pKa = 3.27YY192 pKa = 10.56TRR194 pKa = 11.84LVRR197 pKa = 11.84SYY199 pKa = 11.26GLQQEE204 pKa = 5.57FITPHH209 pKa = 6.55CPQQNGMVEE218 pKa = 3.95RR219 pKa = 11.84LIRR222 pKa = 11.84TLKK225 pKa = 7.64EE226 pKa = 3.87QCVHH230 pKa = 5.07RR231 pKa = 11.84HH232 pKa = 4.88RR233 pKa = 11.84FEE235 pKa = 4.29SQQHH239 pKa = 4.7AMRR242 pKa = 11.84VLGDD246 pKa = 3.82WIQFYY251 pKa = 8.02NHH253 pKa = 6.68RR254 pKa = 11.84RR255 pKa = 11.84PHH257 pKa = 5.38QALGMKK263 pKa = 9.24TPAEE267 pKa = 4.41AYY269 pKa = 10.25ALAAA273 pKa = 4.47
Molecular weight: 31.06 kDa
Isoelectric point according different methods:
Peptides (in silico digests for buttom-up proteomics)
Below you can find in silico digests of the whole proteome with Trypsin, Chymotrypsin, Trypsin+LysC, LysN, ArgC proteases suitable for different mass spec machines.| Try ESI |
 |
|---|
| ChTry ESI |
 |
|---|
| ArgC ESI |
 |
|---|
| LysN ESI |
 |
|---|
| TryLysC ESI |
 |
|---|
| Try MALDI |
 |
|---|
| ChTry MALDI |
 |
|---|
| ArgC MALDI |
 |
|---|
| LysN MALDI |
 |
|---|
| TryLysC MALDI |
 |
|---|
| Try LTQ |
 |
|---|
| ChTry LTQ |
 |
|---|
| ArgC LTQ |
 |
|---|
| LysN LTQ |
 |
|---|
| TryLysC LTQ |
 |
|---|
| Try MSlow |
 |
|---|
| ChTry MSlow |
 |
|---|
| ArgC MSlow |
 |
|---|
| LysN MSlow |
 |
|---|
| TryLysC MSlow |
 |
|---|
| Try MShigh |
 |
|---|
| ChTry MShigh |
 |
|---|
| ArgC MShigh |
 |
|---|
| LysN MShigh |
 |
|---|
| TryLysC MShigh |
 |
|---|
General Statistics
Number of major isoforms |
Number of additional isoforms |
Number of all proteins |
Number of amino acids |
Min. Seq. Length |
Max. Seq. Length |
Avg. Seq. Length |
Avg. Mol. Weight |
|---|---|---|---|---|---|---|---|
0 |
679785 |
29 |
2084 |
328.9 |
36.0 |
Amino acid frequency
Ala |
Cys |
Asp |
Glu |
Phe |
Gly |
His |
Ile |
Lys |
Leu |
|---|---|---|---|---|---|---|---|---|---|
12.596 ± 0.08 | 0.869 ± 0.018 |
5.355 ± 0.035 | 5.813 ± 0.051 |
3.41 ± 0.034 | 8.049 ± 0.053 |
2.425 ± 0.029 | 4.69 ± 0.036 |
3.31 ± 0.041 | 11.033 ± 0.072 |
Met |
Asn |
Gln |
Pro |
Arg |
Ser |
Thr |
Val |
Trp |
Tyr |
|---|---|---|---|---|---|---|---|---|---|
2.418 ± 0.027 | 2.874 ± 0.042 |
4.95 ± 0.037 | 4.581 ± 0.042 |
7.169 ± 0.051 | 5.393 ± 0.037 |
4.496 ± 0.042 | 6.66 ± 0.051 |
1.559 ± 0.03 | 2.35 ± 0.032 |
Most of the basic statistics you can see at this page can be downloaded from this CSV file
Proteome-pI is available under Creative Commons Attribution-NoDerivs license, for more details see here
| Reference: Kozlowski LP. Proteome-pI 2.0: Proteome Isoelectric Point Database Update. Nucleic Acids Res. 2021, doi: 10.1093/nar/gkab944 | Contact: Lukasz P. Kozlowski |
