Catenulispora acidiphila (strain DSM 44928 / JCM 14897 / NBRC 102108 / NRRL B-24433 / ID139908)
Taxonomy: cellular organisms; Bacteria; Terrabacteria group; Actinobacteria; Actinomycetia; Catenulisporales; Catenulisporaceae; Catenulispora; Catenulispora acidiphila
Average proteome isoelectric point is 6.12
Get precalculated fractions of proteins

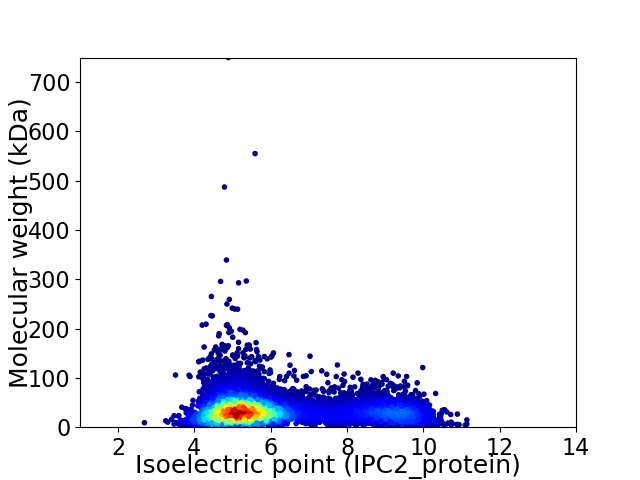
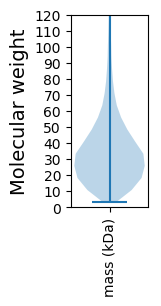
Virtual 2D-PAGE plot for 8909 proteins (isoelectric point calculated using IPC2_protein)
Get csv file with sequences according to given criteria:
* You can choose from 21 different methods for calculating isoelectric point
Summary statistics related to proteome-wise predictions


Protein with the lowest isoelectric point:
>tr|C7QIW6|C7QIW6_CATAD dTDP-glucose 4 6-dehydratase OS=Catenulispora acidiphila (strain DSM 44928 / JCM 14897 / NBRC 102108 / NRRL B-24433 / ID139908) OX=479433 GN=Caci_8193 PE=3 SV=1
MM1 pKa = 7.6AGAAALTALSCAMLSGGPAAASVLPAPYY29 pKa = 10.58GDD31 pKa = 4.81LNADD35 pKa = 3.6GNIDD39 pKa = 4.06LLSVSSTGALQYY51 pKa = 9.7WAGSGTGSVASPVAEE66 pKa = 4.24PSAGDD71 pKa = 3.38FTGDD75 pKa = 3.56VIEE78 pKa = 4.79GAGNFNRR85 pKa = 11.84SSYY88 pKa = 10.92QSLFLYY94 pKa = 10.79SSATDD99 pKa = 3.28HH100 pKa = 7.18AYY102 pKa = 10.82VEE104 pKa = 5.07LGDD107 pKa = 3.73NTGQFSTANEE117 pKa = 4.18VVVPPPSGEE126 pKa = 3.97ASWPVITQLVSPGDD140 pKa = 3.53ITGHH144 pKa = 5.5NRR146 pKa = 11.84ADD148 pKa = 3.31LVARR152 pKa = 11.84VGDD155 pKa = 3.73QLEE158 pKa = 4.56VIPNVALGHH167 pKa = 5.87YY168 pKa = 7.11GAPVAVAGSGWSGRR182 pKa = 11.84TVIGVVDD189 pKa = 3.63ATGDD193 pKa = 3.92GIKK196 pKa = 10.7DD197 pKa = 3.97LIARR201 pKa = 11.84DD202 pKa = 3.83DD203 pKa = 3.63ATGVVWLYY211 pKa = 10.8QGVAGGTFGDD221 pKa = 3.76EE222 pKa = 4.14TTRR225 pKa = 11.84VQIGTGLDD233 pKa = 3.16AADD236 pKa = 3.74YY237 pKa = 10.06PFVITKK243 pKa = 10.44GDD245 pKa = 3.68ADD247 pKa = 4.22GDD249 pKa = 3.95GHH251 pKa = 8.18ADD253 pKa = 3.45VYY255 pKa = 11.61AVGASGGLYY264 pKa = 10.34LSAGNAGGGFGAPTLVSSDD283 pKa = 3.99PAWTGITALGG293 pKa = 3.56
MM1 pKa = 7.6AGAAALTALSCAMLSGGPAAASVLPAPYY29 pKa = 10.58GDD31 pKa = 4.81LNADD35 pKa = 3.6GNIDD39 pKa = 4.06LLSVSSTGALQYY51 pKa = 9.7WAGSGTGSVASPVAEE66 pKa = 4.24PSAGDD71 pKa = 3.38FTGDD75 pKa = 3.56VIEE78 pKa = 4.79GAGNFNRR85 pKa = 11.84SSYY88 pKa = 10.92QSLFLYY94 pKa = 10.79SSATDD99 pKa = 3.28HH100 pKa = 7.18AYY102 pKa = 10.82VEE104 pKa = 5.07LGDD107 pKa = 3.73NTGQFSTANEE117 pKa = 4.18VVVPPPSGEE126 pKa = 3.97ASWPVITQLVSPGDD140 pKa = 3.53ITGHH144 pKa = 5.5NRR146 pKa = 11.84ADD148 pKa = 3.31LVARR152 pKa = 11.84VGDD155 pKa = 3.73QLEE158 pKa = 4.56VIPNVALGHH167 pKa = 5.87YY168 pKa = 7.11GAPVAVAGSGWSGRR182 pKa = 11.84TVIGVVDD189 pKa = 3.63ATGDD193 pKa = 3.92GIKK196 pKa = 10.7DD197 pKa = 3.97LIARR201 pKa = 11.84DD202 pKa = 3.83DD203 pKa = 3.63ATGVVWLYY211 pKa = 10.8QGVAGGTFGDD221 pKa = 3.76EE222 pKa = 4.14TTRR225 pKa = 11.84VQIGTGLDD233 pKa = 3.16AADD236 pKa = 3.74YY237 pKa = 10.06PFVITKK243 pKa = 10.44GDD245 pKa = 3.68ADD247 pKa = 4.22GDD249 pKa = 3.95GHH251 pKa = 8.18ADD253 pKa = 3.45VYY255 pKa = 11.61AVGASGGLYY264 pKa = 10.34LSAGNAGGGFGAPTLVSSDD283 pKa = 3.99PAWTGITALGG293 pKa = 3.56
Molecular weight: 29.03 kDa
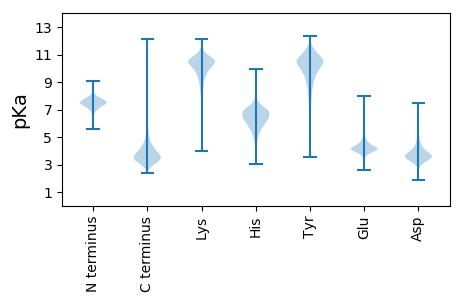
Isoelectric point according different methods:
Protein with the highest isoelectric point:
>tr|C7Q0H6|C7Q0H6_CATAD Uncharacterized protein OS=Catenulispora acidiphila (strain DSM 44928 / JCM 14897 / NBRC 102108 / NRRL B-24433 / ID139908) OX=479433 GN=Caci_8694 PE=4 SV=1
MM1 pKa = 7.56WARR4 pKa = 11.84ALKK7 pKa = 10.28RR8 pKa = 11.84LAALSIPVRR17 pKa = 11.84MLRR20 pKa = 11.84PVWFFTMRR28 pKa = 11.84FLPKK32 pKa = 9.86RR33 pKa = 11.84FRR35 pKa = 11.84PMWFLPTRR43 pKa = 11.84FLPRR47 pKa = 11.84LAAGG51 pKa = 3.73
MM1 pKa = 7.56WARR4 pKa = 11.84ALKK7 pKa = 10.28RR8 pKa = 11.84LAALSIPVRR17 pKa = 11.84MLRR20 pKa = 11.84PVWFFTMRR28 pKa = 11.84FLPKK32 pKa = 9.86RR33 pKa = 11.84FRR35 pKa = 11.84PMWFLPTRR43 pKa = 11.84FLPRR47 pKa = 11.84LAAGG51 pKa = 3.73
Molecular weight: 6.22 kDa
Isoelectric point according different methods:
Peptides (in silico digests for buttom-up proteomics)
Below you can find in silico digests of the whole proteome with Trypsin, Chymotrypsin, Trypsin+LysC, LysN, ArgC proteases suitable for different mass spec machines.| Try ESI |
 |
|---|
| ChTry ESI |
 |
|---|
| ArgC ESI |
 |
|---|
| LysN ESI |
 |
|---|
| TryLysC ESI |
 |
|---|
| Try MALDI |
 |
|---|
| ChTry MALDI |
 |
|---|
| ArgC MALDI |
 |
|---|
| LysN MALDI |
 |
|---|
| TryLysC MALDI |
 |
|---|
| Try LTQ |
 |
|---|
| ChTry LTQ |
 |
|---|
| ArgC LTQ |
 |
|---|
| LysN LTQ |
 |
|---|
| TryLysC LTQ |
 |
|---|
| Try MSlow |
 |
|---|
| ChTry MSlow |
 |
|---|
| ArgC MSlow |
 |
|---|
| LysN MSlow |
 |
|---|
| TryLysC MSlow |
 |
|---|
| Try MShigh |
 |
|---|
| ChTry MShigh |
 |
|---|
| ArgC MShigh |
 |
|---|
| LysN MShigh |
 |
|---|
| TryLysC MShigh |
 |
|---|
General Statistics
Number of major isoforms |
Number of additional isoforms |
Number of all proteins |
Number of amino acids |
Min. Seq. Length |
Max. Seq. Length |
Avg. Seq. Length |
Avg. Mol. Weight |
|---|---|---|---|---|---|---|---|
0 |
3085666 |
29 |
7149 |
346.4 |
36.84 |
Amino acid frequency
Ala |
Cys |
Asp |
Glu |
Phe |
Gly |
His |
Ile |
Lys |
Leu |
|---|---|---|---|---|---|---|---|---|---|
14.097 ± 0.04 | 0.751 ± 0.007 |
5.88 ± 0.022 | 5.123 ± 0.03 |
2.895 ± 0.016 | 9.275 ± 0.027 |
2.176 ± 0.014 | 3.6 ± 0.015 |
2.1 ± 0.018 | 9.82 ± 0.034 |
Met |
Asn |
Gln |
Pro |
Arg |
Ser |
Thr |
Val |
Trp |
Tyr |
|---|---|---|---|---|---|---|---|---|---|
1.831 ± 0.01 | 2.163 ± 0.019 |
5.909 ± 0.022 | 3.092 ± 0.017 |
6.98 ± 0.037 | 5.854 ± 0.027 |
6.46 ± 0.033 | 8.286 ± 0.021 |
1.528 ± 0.011 | 2.18 ± 0.015 |
Most of the basic statistics you can see at this page can be downloaded from this CSV file
Proteome-pI is available under Creative Commons Attribution-NoDerivs license, for more details see here
| Reference: Kozlowski LP. Proteome-pI 2.0: Proteome Isoelectric Point Database Update. Nucleic Acids Res. 2021, doi: 10.1093/nar/gkab944 | Contact: Lukasz P. Kozlowski |
