Coriobacterium glomerans (strain ATCC 49209 / DSM 20642 / JCM 10262 / PW2)
Taxonomy: cellular organisms; Bacteria; Terrabacteria group; Actinobacteria; Coriobacteriia; Coriobacteriales; Coriobacteriaceae; Coriobacterium; Coriobacterium glomerans
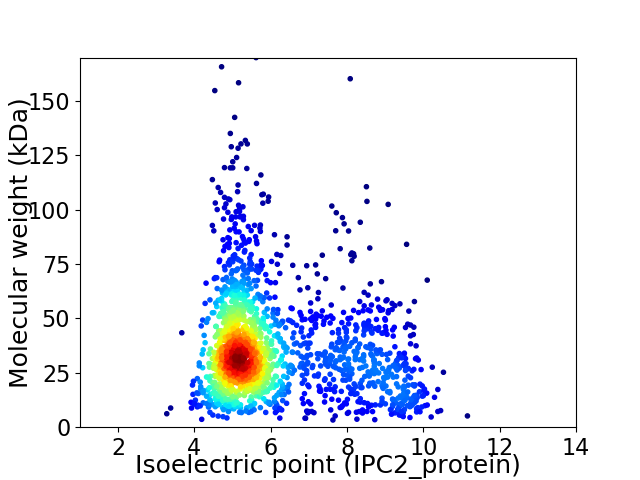
Average proteome isoelectric point is 6.13
Get precalculated fractions of proteins

Virtual 2D-PAGE plot for 1768 proteins (isoelectric point calculated using IPC2_protein)
Get csv file with sequences according to given criteria:
* You can choose from 21 different methods for calculating isoelectric point
Summary statistics related to proteome-wise predictions


Protein with the lowest isoelectric point:
>tr|F2N9R7|F2N9R7_CORGP Uncharacterized protein OS=Coriobacterium glomerans (strain ATCC 49209 / DSM 20642 / JCM 10262 / PW2) OX=700015 GN=Corgl_1062 PE=3 SV=1
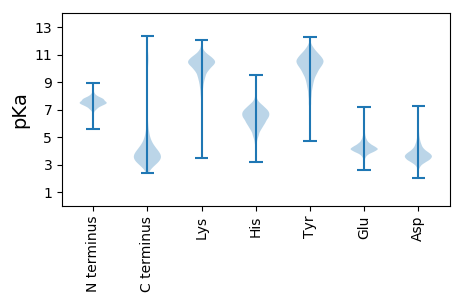
MM1 pKa = 7.53ALIDD5 pKa = 4.31PVLIDD10 pKa = 3.65LTGKK14 pKa = 10.67AEE16 pKa = 4.27GPGEE20 pKa = 4.15SFTFSGHH27 pKa = 6.06AAASGYY33 pKa = 11.39DD34 pKa = 3.05MGEE37 pKa = 3.67RR38 pKa = 11.84HH39 pKa = 6.81LEE41 pKa = 4.21LEE43 pKa = 5.03DD44 pKa = 3.81GLSFEE49 pKa = 4.94VAFTNTGDD57 pKa = 4.34GILLTGMVRR66 pKa = 11.84GRR68 pKa = 11.84AAGVCDD74 pKa = 3.37RR75 pKa = 11.84CLDD78 pKa = 3.51VARR81 pKa = 11.84IDD83 pKa = 3.16IAGAIEE89 pKa = 4.39EE90 pKa = 4.76YY91 pKa = 10.89YY92 pKa = 11.08LLEE95 pKa = 4.73KK96 pKa = 10.46PHH98 pKa = 7.4DD99 pKa = 3.91PTCYY103 pKa = 9.92EE104 pKa = 4.99DD105 pKa = 4.68GFEE108 pKa = 4.61LLGSDD113 pKa = 4.63RR114 pKa = 11.84VVDD117 pKa = 4.5LAAPLSDD124 pKa = 4.95AVITDD129 pKa = 3.52TPFALLCSPDD139 pKa = 3.74CAGLCPVCGCNLNHH153 pKa = 7.4AACDD157 pKa = 3.73CMTDD161 pKa = 3.15SFDD164 pKa = 3.42VARR167 pKa = 11.84SGEE170 pKa = 4.17EE171 pKa = 3.95SPFAALRR178 pKa = 11.84DD179 pKa = 3.94LEE181 pKa = 4.66IEE183 pKa = 4.12
MM1 pKa = 7.53ALIDD5 pKa = 4.31PVLIDD10 pKa = 3.65LTGKK14 pKa = 10.67AEE16 pKa = 4.27GPGEE20 pKa = 4.15SFTFSGHH27 pKa = 6.06AAASGYY33 pKa = 11.39DD34 pKa = 3.05MGEE37 pKa = 3.67RR38 pKa = 11.84HH39 pKa = 6.81LEE41 pKa = 4.21LEE43 pKa = 5.03DD44 pKa = 3.81GLSFEE49 pKa = 4.94VAFTNTGDD57 pKa = 4.34GILLTGMVRR66 pKa = 11.84GRR68 pKa = 11.84AAGVCDD74 pKa = 3.37RR75 pKa = 11.84CLDD78 pKa = 3.51VARR81 pKa = 11.84IDD83 pKa = 3.16IAGAIEE89 pKa = 4.39EE90 pKa = 4.76YY91 pKa = 10.89YY92 pKa = 11.08LLEE95 pKa = 4.73KK96 pKa = 10.46PHH98 pKa = 7.4DD99 pKa = 3.91PTCYY103 pKa = 9.92EE104 pKa = 4.99DD105 pKa = 4.68GFEE108 pKa = 4.61LLGSDD113 pKa = 4.63RR114 pKa = 11.84VVDD117 pKa = 4.5LAAPLSDD124 pKa = 4.95AVITDD129 pKa = 3.52TPFALLCSPDD139 pKa = 3.74CAGLCPVCGCNLNHH153 pKa = 7.4AACDD157 pKa = 3.73CMTDD161 pKa = 3.15SFDD164 pKa = 3.42VARR167 pKa = 11.84SGEE170 pKa = 4.17EE171 pKa = 3.95SPFAALRR178 pKa = 11.84DD179 pKa = 3.94LEE181 pKa = 4.66IEE183 pKa = 4.12
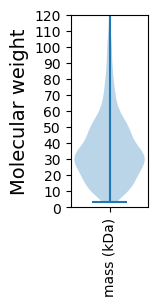
Molecular weight: 19.37 kDa
Isoelectric point according different methods:
Protein with the highest isoelectric point:
>tr|F2N9H1|F2N9H1_CORGP Ribosome-recycling factor OS=Coriobacterium glomerans (strain ATCC 49209 / DSM 20642 / JCM 10262 / PW2) OX=700015 GN=frr PE=3 SV=1
MM1 pKa = 7.35KK2 pKa = 9.42RR3 pKa = 11.84TYY5 pKa = 10.34QPNKK9 pKa = 8.64RR10 pKa = 11.84KK11 pKa = 9.51RR12 pKa = 11.84AKK14 pKa = 9.92SHH16 pKa = 5.28GFRR19 pKa = 11.84ARR21 pKa = 11.84MATKK25 pKa = 10.27GGRR28 pKa = 11.84AVLARR33 pKa = 11.84RR34 pKa = 11.84RR35 pKa = 11.84AKK37 pKa = 9.9GRR39 pKa = 11.84RR40 pKa = 11.84RR41 pKa = 11.84LTVV44 pKa = 2.76
MM1 pKa = 7.35KK2 pKa = 9.42RR3 pKa = 11.84TYY5 pKa = 10.34QPNKK9 pKa = 8.64RR10 pKa = 11.84KK11 pKa = 9.51RR12 pKa = 11.84AKK14 pKa = 9.92SHH16 pKa = 5.28GFRR19 pKa = 11.84ARR21 pKa = 11.84MATKK25 pKa = 10.27GGRR28 pKa = 11.84AVLARR33 pKa = 11.84RR34 pKa = 11.84RR35 pKa = 11.84AKK37 pKa = 9.9GRR39 pKa = 11.84RR40 pKa = 11.84RR41 pKa = 11.84LTVV44 pKa = 2.76
Molecular weight: 5.18 kDa
Isoelectric point according different methods:
Peptides (in silico digests for buttom-up proteomics)
Below you can find in silico digests of the whole proteome with Trypsin, Chymotrypsin, Trypsin+LysC, LysN, ArgC proteases suitable for different mass spec machines.| Try ESI |
 |
|---|
| ChTry ESI |
 |
|---|
| ArgC ESI |
 |
|---|
| LysN ESI |
 |
|---|
| TryLysC ESI |
 |
|---|
| Try MALDI |
 |
|---|
| ChTry MALDI |
 |
|---|
| ArgC MALDI |
 |
|---|
| LysN MALDI |
 |
|---|
| TryLysC MALDI |
 |
|---|
| Try LTQ |
 |
|---|
| ChTry LTQ |
 |
|---|
| ArgC LTQ |
 |
|---|
| LysN LTQ |
 |
|---|
| TryLysC LTQ |
 |
|---|
| Try MSlow |
 |
|---|
| ChTry MSlow |
 |
|---|
| ArgC MSlow |
 |
|---|
| LysN MSlow |
 |
|---|
| TryLysC MSlow |
 |
|---|
| Try MShigh |
 |
|---|
| ChTry MShigh |
 |
|---|
| ArgC MShigh |
 |
|---|
| LysN MShigh |
 |
|---|
| TryLysC MShigh |
 |
|---|
General Statistics
Number of major isoforms |
Number of additional isoforms |
Number of all proteins |
Number of amino acids |
Min. Seq. Length |
Max. Seq. Length |
Avg. Seq. Length |
Avg. Mol. Weight |
|---|---|---|---|---|---|---|---|
0 |
613803 |
30 |
1560 |
347.2 |
37.86 |
Amino acid frequency
Ala |
Cys |
Asp |
Glu |
Phe |
Gly |
His |
Ile |
Lys |
Leu |
|---|---|---|---|---|---|---|---|---|---|
11.264 ± 0.077 | 1.596 ± 0.025 |
6.286 ± 0.054 | 6.032 ± 0.06 |
3.662 ± 0.04 | 8.109 ± 0.048 |
1.986 ± 0.027 | 6.115 ± 0.049 |
3.156 ± 0.046 | 9.414 ± 0.062 |
Met |
Asn |
Gln |
Pro |
Arg |
Ser |
Thr |
Val |
Trp |
Tyr |
|---|---|---|---|---|---|---|---|---|---|
2.664 ± 0.028 | 2.559 ± 0.034 |
4.209 ± 0.031 | 2.76 ± 0.031 |
7.313 ± 0.064 | 6.7 ± 0.049 |
5.141 ± 0.039 | 7.434 ± 0.049 |
1.03 ± 0.021 | 2.569 ± 0.03 |
Most of the basic statistics you can see at this page can be downloaded from this CSV file
Proteome-pI is available under Creative Commons Attribution-NoDerivs license, for more details see here
| Reference: Kozlowski LP. Proteome-pI 2.0: Proteome Isoelectric Point Database Update. Nucleic Acids Res. 2021, doi: 10.1093/nar/gkab944 | Contact: Lukasz P. Kozlowski |
