Streptomyces autolyticus
Taxonomy: cellular organisms; Bacteria; Terrabacteria group; Actinobacteria; Actinomycetia; Streptomycetales; Streptomycetaceae; Streptomyces
Average proteome isoelectric point is 6.39
Get precalculated fractions of proteins

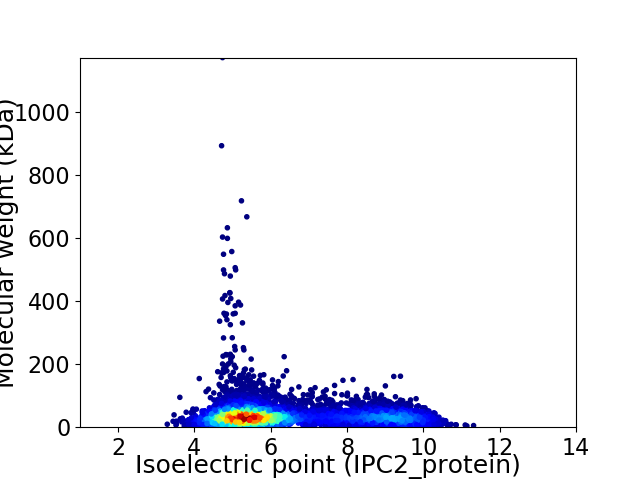
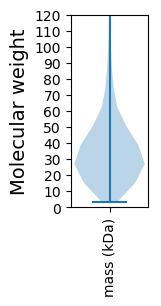
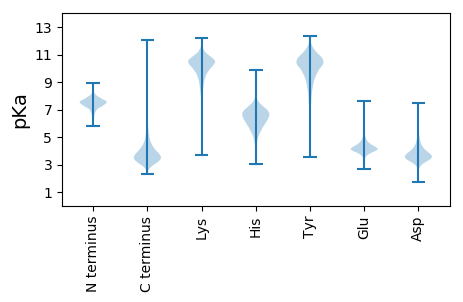
Virtual 2D-PAGE plot for 7686 proteins (isoelectric point calculated using IPC2_protein)
Get csv file with sequences according to given criteria:
* You can choose from 21 different methods for calculating isoelectric point
Summary statistics related to proteome-wise predictions


Protein with the lowest isoelectric point:
>tr|A0A1P8Y0G2|A0A1P8Y0G2_9ACTN Prepilin peptidase OS=Streptomyces autolyticus OX=75293 GN=BV401_28195 PE=3 SV=1
MM1 pKa = 7.89RR2 pKa = 11.84MYY4 pKa = 10.29RR5 pKa = 11.84TMAATATLALALGGAALAAPAAQAAATTSGSLVHH39 pKa = 7.09EE40 pKa = 5.54DD41 pKa = 3.54GEE43 pKa = 4.49LWYY46 pKa = 10.53KK47 pKa = 10.45AAAGQKK53 pKa = 10.0NDD55 pKa = 3.83LTVSEE60 pKa = 4.52QIVNRR65 pKa = 11.84GEE67 pKa = 3.89FEE69 pKa = 3.99SYY71 pKa = 10.72YY72 pKa = 11.25VLTFRR77 pKa = 11.84DD78 pKa = 3.77NGDD81 pKa = 2.93ITIDD85 pKa = 3.49PEE87 pKa = 3.82AANWDD92 pKa = 4.13EE93 pKa = 4.51CVHH96 pKa = 6.44PAAGDD101 pKa = 3.55HH102 pKa = 5.98TVAQCAVEE110 pKa = 4.41IPQNSDD116 pKa = 2.97DD117 pKa = 4.28SDD119 pKa = 4.06NFDD122 pKa = 3.96VDD124 pKa = 5.08LGDD127 pKa = 4.58GNDD130 pKa = 3.65TAKK133 pKa = 10.19IDD135 pKa = 4.28PNGSAYY141 pKa = 10.43AGIHH145 pKa = 6.08GGSGDD150 pKa = 4.63DD151 pKa = 3.7VLQGSAAPTFYY162 pKa = 11.4GEE164 pKa = 4.98DD165 pKa = 3.78GNDD168 pKa = 3.84KK169 pKa = 10.38IDD171 pKa = 3.74GGGGVMGFGAYY182 pKa = 10.05GGDD185 pKa = 3.69GDD187 pKa = 5.4DD188 pKa = 4.88TITNCAQEE196 pKa = 4.37CRR198 pKa = 11.84GGAGNDD204 pKa = 3.8TIVGGSEE211 pKa = 4.08DD212 pKa = 3.67NILRR216 pKa = 11.84GEE218 pKa = 4.2SGDD221 pKa = 4.26DD222 pKa = 3.05ILRR225 pKa = 11.84GGKK228 pKa = 8.19GTDD231 pKa = 3.41AIYY234 pKa = 10.54GGEE237 pKa = 4.91DD238 pKa = 3.41DD239 pKa = 5.41DD240 pKa = 4.4EE241 pKa = 6.37LYY243 pKa = 11.23GEE245 pKa = 4.82EE246 pKa = 5.47GDD248 pKa = 3.76DD249 pKa = 3.47TLYY252 pKa = 11.39GNSGDD257 pKa = 3.79DD258 pKa = 3.93VLWGGQGNDD267 pKa = 3.81TLSGGPGHH275 pKa = 6.62NEE277 pKa = 3.55VHH279 pKa = 6.44QDD281 pKa = 3.01
MM1 pKa = 7.89RR2 pKa = 11.84MYY4 pKa = 10.29RR5 pKa = 11.84TMAATATLALALGGAALAAPAAQAAATTSGSLVHH39 pKa = 7.09EE40 pKa = 5.54DD41 pKa = 3.54GEE43 pKa = 4.49LWYY46 pKa = 10.53KK47 pKa = 10.45AAAGQKK53 pKa = 10.0NDD55 pKa = 3.83LTVSEE60 pKa = 4.52QIVNRR65 pKa = 11.84GEE67 pKa = 3.89FEE69 pKa = 3.99SYY71 pKa = 10.72YY72 pKa = 11.25VLTFRR77 pKa = 11.84DD78 pKa = 3.77NGDD81 pKa = 2.93ITIDD85 pKa = 3.49PEE87 pKa = 3.82AANWDD92 pKa = 4.13EE93 pKa = 4.51CVHH96 pKa = 6.44PAAGDD101 pKa = 3.55HH102 pKa = 5.98TVAQCAVEE110 pKa = 4.41IPQNSDD116 pKa = 2.97DD117 pKa = 4.28SDD119 pKa = 4.06NFDD122 pKa = 3.96VDD124 pKa = 5.08LGDD127 pKa = 4.58GNDD130 pKa = 3.65TAKK133 pKa = 10.19IDD135 pKa = 4.28PNGSAYY141 pKa = 10.43AGIHH145 pKa = 6.08GGSGDD150 pKa = 4.63DD151 pKa = 3.7VLQGSAAPTFYY162 pKa = 11.4GEE164 pKa = 4.98DD165 pKa = 3.78GNDD168 pKa = 3.84KK169 pKa = 10.38IDD171 pKa = 3.74GGGGVMGFGAYY182 pKa = 10.05GGDD185 pKa = 3.69GDD187 pKa = 5.4DD188 pKa = 4.88TITNCAQEE196 pKa = 4.37CRR198 pKa = 11.84GGAGNDD204 pKa = 3.8TIVGGSEE211 pKa = 4.08DD212 pKa = 3.67NILRR216 pKa = 11.84GEE218 pKa = 4.2SGDD221 pKa = 4.26DD222 pKa = 3.05ILRR225 pKa = 11.84GGKK228 pKa = 8.19GTDD231 pKa = 3.41AIYY234 pKa = 10.54GGEE237 pKa = 4.91DD238 pKa = 3.41DD239 pKa = 5.41DD240 pKa = 4.4EE241 pKa = 6.37LYY243 pKa = 11.23GEE245 pKa = 4.82EE246 pKa = 5.47GDD248 pKa = 3.76DD249 pKa = 3.47TLYY252 pKa = 11.39GNSGDD257 pKa = 3.79DD258 pKa = 3.93VLWGGQGNDD267 pKa = 3.81TLSGGPGHH275 pKa = 6.62NEE277 pKa = 3.55VHH279 pKa = 6.44QDD281 pKa = 3.01
Molecular weight: 28.81 kDa
Isoelectric point according different methods:
Protein with the highest isoelectric point:
>tr|A0A1P8XYL7|A0A1P8XYL7_9ACTN AraC family transcriptional regulator OS=Streptomyces autolyticus OX=75293 GN=BV401_25590 PE=4 SV=1
MM1 pKa = 7.69SKK3 pKa = 9.0RR4 pKa = 11.84TFQPNNRR11 pKa = 11.84RR12 pKa = 11.84RR13 pKa = 11.84AKK15 pKa = 8.7THH17 pKa = 5.15GFRR20 pKa = 11.84LRR22 pKa = 11.84MRR24 pKa = 11.84TRR26 pKa = 11.84AGRR29 pKa = 11.84AILASRR35 pKa = 11.84RR36 pKa = 11.84SKK38 pKa = 10.75GRR40 pKa = 11.84ARR42 pKa = 11.84LSAA45 pKa = 3.91
MM1 pKa = 7.69SKK3 pKa = 9.0RR4 pKa = 11.84TFQPNNRR11 pKa = 11.84RR12 pKa = 11.84RR13 pKa = 11.84AKK15 pKa = 8.7THH17 pKa = 5.15GFRR20 pKa = 11.84LRR22 pKa = 11.84MRR24 pKa = 11.84TRR26 pKa = 11.84AGRR29 pKa = 11.84AILASRR35 pKa = 11.84RR36 pKa = 11.84SKK38 pKa = 10.75GRR40 pKa = 11.84ARR42 pKa = 11.84LSAA45 pKa = 3.91
Molecular weight: 5.28 kDa
Isoelectric point according different methods:
Peptides (in silico digests for buttom-up proteomics)
Below you can find in silico digests of the whole proteome with Trypsin, Chymotrypsin, Trypsin+LysC, LysN, ArgC proteases suitable for different mass spec machines.| Try ESI |
 |
|---|
| ChTry ESI |
 |
|---|
| ArgC ESI |
 |
|---|
| LysN ESI |
 |
|---|
| TryLysC ESI |
 |
|---|
| Try MALDI |
 |
|---|
| ChTry MALDI |
 |
|---|
| ArgC MALDI |
 |
|---|
| LysN MALDI |
 |
|---|
| TryLysC MALDI |
 |
|---|
| Try LTQ |
 |
|---|
| ChTry LTQ |
 |
|---|
| ArgC LTQ |
 |
|---|
| LysN LTQ |
 |
|---|
| TryLysC LTQ |
 |
|---|
| Try MSlow |
 |
|---|
| ChTry MSlow |
 |
|---|
| ArgC MSlow |
 |
|---|
| LysN MSlow |
 |
|---|
| TryLysC MSlow |
 |
|---|
| Try MShigh |
 |
|---|
| ChTry MShigh |
 |
|---|
| ArgC MShigh |
 |
|---|
| LysN MShigh |
 |
|---|
| TryLysC MShigh |
 |
|---|
General Statistics
Number of major isoforms |
Number of additional isoforms |
Number of all proteins |
Number of amino acids |
Min. Seq. Length |
Max. Seq. Length |
Avg. Seq. Length |
Avg. Mol. Weight |
|---|---|---|---|---|---|---|---|
0 |
2766839 |
29 |
11273 |
360.0 |
38.5 |
Amino acid frequency
Ala |
Cys |
Asp |
Glu |
Phe |
Gly |
His |
Ile |
Lys |
Leu |
|---|---|---|---|---|---|---|---|---|---|
13.567 ± 0.042 | 0.782 ± 0.007 |
5.988 ± 0.022 | 5.809 ± 0.029 |
2.699 ± 0.013 | 9.709 ± 0.028 |
2.363 ± 0.014 | 3.287 ± 0.02 |
2.009 ± 0.024 | 10.284 ± 0.031 |
Met |
Asn |
Gln |
Pro |
Arg |
Ser |
Thr |
Val |
Trp |
Tyr |
|---|---|---|---|---|---|---|---|---|---|
1.747 ± 0.012 | 1.706 ± 0.014 |
6.183 ± 0.031 | 2.659 ± 0.015 |
8.226 ± 0.029 | 5.128 ± 0.024 |
6.076 ± 0.023 | 8.266 ± 0.03 |
1.508 ± 0.012 | 2.004 ± 0.015 |
Most of the basic statistics you can see at this page can be downloaded from this CSV file
Proteome-pI is available under Creative Commons Attribution-NoDerivs license, for more details see here
| Reference: Kozlowski LP. Proteome-pI 2.0: Proteome Isoelectric Point Database Update. Nucleic Acids Res. 2021, doi: 10.1093/nar/gkab944 | Contact: Lukasz P. Kozlowski |
